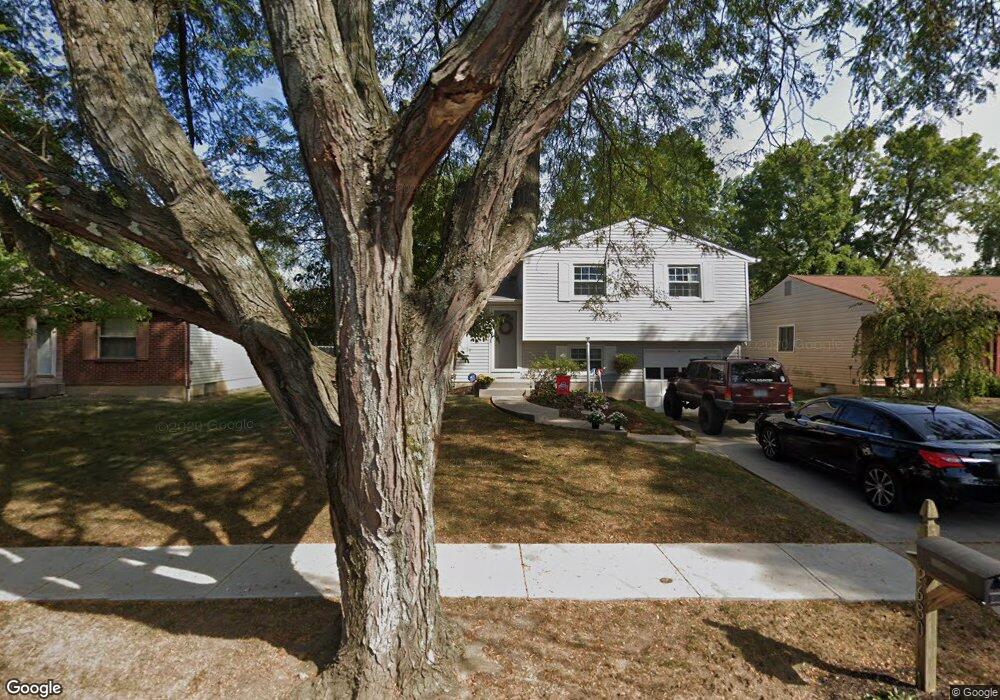
2680 Bella Via Ave Columbus, OH 43231
Northern Woods NeighborhoodEstimated Value: $270,826 - $295,000
3
Beds
2
Baths
1,169
Sq Ft
$244/Sq Ft
Est. Value
About This Home
This home is located at 2680 Bella Via Ave, Columbus, OH 43231 and is currently estimated at $285,207, approximately $243 per square foot. 2680 Bella Via Ave is a home located in Franklin County with nearby schools including Avalon Elementary School, Northgate Intermediate, and Woodward Park Middle School.
Ownership History
Date
Name
Owned For
Owner Type
Purchase Details
Closed on
Jun 15, 2021
Sold by
Stanley Phillip Wayne and Stanley Phillip W
Bought by
Core Halen and Livingston Kaylie
Current Estimated Value
Home Financials for this Owner
Home Financials are based on the most recent Mortgage that was taken out on this home.
Original Mortgage
$189,000
Outstanding Balance
$171,116
Interest Rate
2.9%
Mortgage Type
New Conventional
Estimated Equity
$114,091
Purchase Details
Closed on
May 31, 2001
Sold by
Muncy Stanley Judith
Bought by
Stanley Phillip Wayne
Home Financials for this Owner
Home Financials are based on the most recent Mortgage that was taken out on this home.
Original Mortgage
$24,680
Interest Rate
7.18%
Purchase Details
Closed on
Oct 13, 1999
Sold by
Muncy Stanley Judith
Bought by
Stanley Phillip Wayne
Purchase Details
Closed on
Jun 12, 1986
Bought by
Fichter Brent M
Purchase Details
Closed on
Dec 1, 1977
Create a Home Valuation Report for This Property
The Home Valuation Report is an in-depth analysis detailing your home's value as well as a comparison with similar homes in the area
Home Values in the Area
Average Home Value in this Area
Purchase History
| Date | Buyer | Sale Price | Title Company |
|---|---|---|---|
| Core Halen | $225,000 | First American Title Ins Co | |
| Stanley Phillip Wayne | -- | -- | |
| Stanley Phillip Wayne | -- | -- | |
| Fichter Brent M | $62,200 | -- | |
| -- | $37,000 | -- |
Source: Public Records
Mortgage History
| Date | Status | Borrower | Loan Amount |
|---|---|---|---|
| Open | Core Halen | $189,000 | |
| Previous Owner | Stanley Phillip Wayne | $24,680 |
Source: Public Records
Tax History Compared to Growth
Tax History
| Year | Tax Paid | Tax Assessment Tax Assessment Total Assessment is a certain percentage of the fair market value that is determined by local assessors to be the total taxable value of land and additions on the property. | Land | Improvement |
|---|---|---|---|---|
| 2024 | $2,694 | $60,030 | $19,950 | $40,080 |
| 2023 | $2,660 | $60,030 | $19,950 | $40,080 |
| 2022 | $2,426 | $46,770 | $13,130 | $33,640 |
| 2021 | $2,430 | $46,770 | $13,130 | $33,640 |
| 2020 | $2,433 | $46,770 | $13,130 | $33,640 |
| 2019 | $2,302 | $37,940 | $10,500 | $27,440 |
| 2018 | $2,181 | $37,940 | $10,500 | $27,440 |
| 2017 | $2,287 | $37,940 | $10,500 | $27,440 |
| 2016 | $2,275 | $34,340 | $9,380 | $24,960 |
| 2015 | $2,065 | $34,340 | $9,380 | $24,960 |
| 2014 | $2,070 | $34,340 | $9,380 | $24,960 |
| 2013 | $1,074 | $36,120 | $9,870 | $26,250 |
Source: Public Records
Map
Nearby Homes
- 2727 Patrick Ave
- 2721 Woodland Trail Dr Unit 2721
- 2623 Blendon Woods Blvd
- 2677-2679 Blossom Ave
- 2800 Overview Ct Unit 2800B
- 2292 Laurelwood Dr Unit 2292L
- 2981 Blendon Woods Blvd Unit 983
- 3001 Cooper Bluff Dr Unit 3001
- 6048 Pinemoor St
- 3066 Ravine Pointe Dr Unit 3066
- 3038 Highcliff Ct
- 5841 Forest Hills Blvd Unit 5843
- 2197 Bayfield Dr
- 3070 Highcliff Ct Unit 3070
- 3068 Highcliff Ct Unit 3068
- 5678 Great Hall Ct Unit 12C
- 2120 Willowick Dr Unit B
- 2250 Webster Canyon Ct
- 5681 Oliver St
- 5670 Oliver St
- 2688 Bella Via Ave
- 2670 Bella Via Ave
- 2599 Tiller Ln Unit STE.A
- 2599 Tiller Ln
- 2696 Bella Via Ave
- 2662 Bella Via Ave
- 2695 Central Park Place
- 2679 Bella Via Ave
- 2687 Bella Via Ave
- 2704 Bella Via Ave
- 2654 Bella Via Ave
- 6030 Northern Pine St
- 2689 Central Park Place
- 2695 Bella Via Ave
- 2707 Central Park Place
- 6105 Central Park Dr
- 2646 Bella Via Ave
- 6081 Central Park Dr
- 2634 Blue Spruce Cir
- 2645 Bella Via Ave