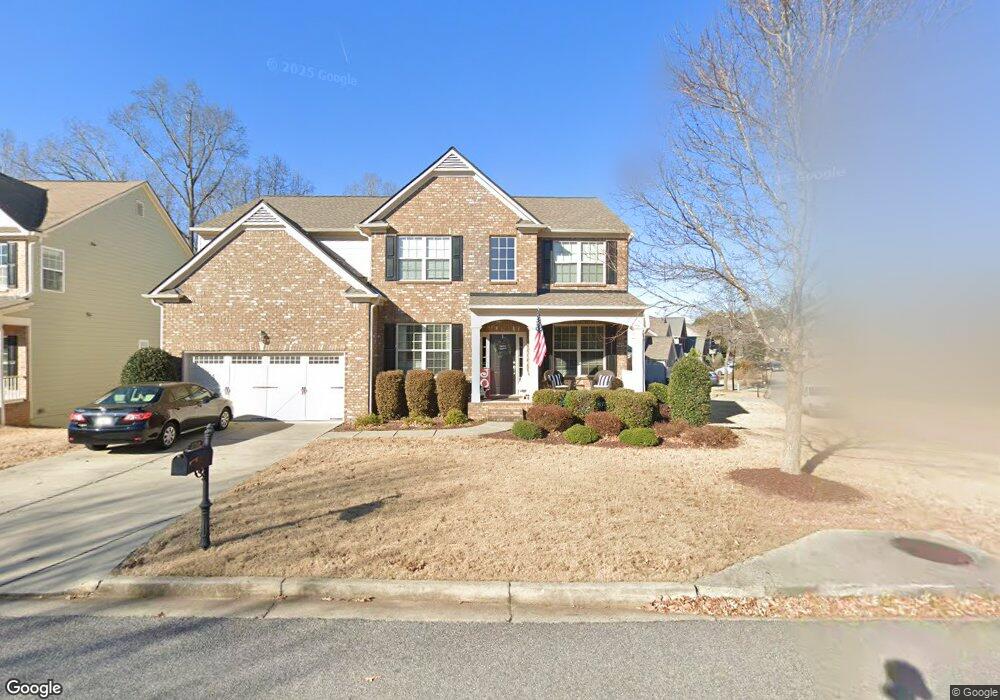
2680 Blackstock Dr Cumming, GA 30041
Estimated Value: $694,889 - $708,000
4
Beds
3
Baths
2,622
Sq Ft
$267/Sq Ft
Est. Value
About This Home
This home is located at 2680 Blackstock Dr, Cumming, GA 30041 and is currently estimated at $700,222, approximately $267 per square foot. 2680 Blackstock Dr is a home located in Forsyth County with nearby schools including Haw Creek Elementary School, Lakeside Middle School, and South Forsyth High School.
Ownership History
Date
Name
Owned For
Owner Type
Purchase Details
Closed on
Aug 22, 2025
Sold by
Unison Midgard Holdings Llc
Bought by
Morris Troy A and Morris Jeanette D
Current Estimated Value
Home Financials for this Owner
Home Financials are based on the most recent Mortgage that was taken out on this home.
Original Mortgage
$665,000
Interest Rate
6.81%
Mortgage Type
New Conventional
Purchase Details
Closed on
Jun 27, 2025
Sold by
Morris Troy A and Morris Jeanette D
Bought by
Haque Asiya and Shaikh Muhammad Zeeshan
Home Financials for this Owner
Home Financials are based on the most recent Mortgage that was taken out on this home.
Original Mortgage
$665,000
Interest Rate
6.81%
Mortgage Type
New Conventional
Purchase Details
Closed on
Mar 31, 2011
Sold by
Archway Custom Homes Llc
Bought by
Morris Troy A and Morris Jeanette D
Home Financials for this Owner
Home Financials are based on the most recent Mortgage that was taken out on this home.
Original Mortgage
$260,789
Interest Rate
4.75%
Mortgage Type
FHA
Create a Home Valuation Report for This Property
The Home Valuation Report is an in-depth analysis detailing your home's value as well as a comparison with similar homes in the area
Home Values in the Area
Average Home Value in this Area
Purchase History
| Date | Buyer | Sale Price | Title Company |
|---|---|---|---|
| Morris Troy A | -- | None Listed On Document | |
| Haque Asiya | $700,000 | None Listed On Document | |
| Haque Asiya | $700,000 | None Listed On Document | |
| Morris Troy A | $267,600 | -- |
Source: Public Records
Mortgage History
| Date | Status | Borrower | Loan Amount |
|---|---|---|---|
| Previous Owner | Haque Asiya | $665,000 | |
| Previous Owner | Morris Troy A | $260,789 |
Source: Public Records
Tax History Compared to Growth
Tax History
| Year | Tax Paid | Tax Assessment Tax Assessment Total Assessment is a certain percentage of the fair market value that is determined by local assessors to be the total taxable value of land and additions on the property. | Land | Improvement |
|---|---|---|---|---|
| 2025 | $5,829 | $254,744 | $72,000 | $182,744 |
| 2024 | $5,829 | $237,688 | $60,000 | $177,688 |
| 2023 | $5,443 | $221,144 | $60,000 | $161,144 |
| 2022 | $4,625 | $136,560 | $32,000 | $104,560 |
| 2021 | $3,771 | $136,560 | $32,000 | $104,560 |
| 2020 | $3,832 | $138,764 | $32,000 | $106,764 |
| 2019 | $3,862 | $139,652 | $32,000 | $107,652 |
| 2018 | $3,684 | $133,216 | $28,000 | $105,216 |
| 2017 | $3,438 | $123,868 | $28,000 | $95,868 |
| 2016 | $3,382 | $121,868 | $26,000 | $95,868 |
| 2015 | $3,157 | $113,548 | $26,000 | $87,548 |
| 2014 | $2,589 | $97,792 | $0 | $0 |
Source: Public Records
Map
Nearby Homes
- 2640 Blackstock Dr
- 2625 Blackstock Dr
- 3030 Blackstock Dr
- 2410 Overpass
- Belville Plan at The Glade
- Manchester Plan at The Glade
- Milton Plan at The Glade
- 5613 Lancashire Ln
- 2350 Gladstone Place
- 2216 Trammel Rd
- 2400 Gants Hill Place
- Lot 8 Cambridge Hills Rd
- 5303 Davenport Manor
- 1458 Edenfield Pointe
- 1458 Edenfield Pte
- 2540 Marsha Cir
- 5349 Davenport Manor
- 6143 Menlow Ct
- 5985 Marlow Dr
- 2670 Blackstock Dr
- 2685 Blackstock Dr
- 2675 Blackstock Dr
- 2720 Irwin Ct
- 2705 Irwin Ct
- 0 Irwin Ct Unit 8032411
- 0 Irwin Ct Unit 8386992
- 2665 Blackstock Dr
- 2660 Blackstock Dr
- 2715 Blackstock Dr
- 2730 Irwin Ct
- 2725 Irwin Ct
- 2650 Blackstock Dr
- 2655 Blackstock Dr
- 2720 Blackstock Dr
- 2740 Irwin Ct
- 2725 Blackstock Dr
- 0 Blackstock Dr Unit 7029219
- 0 Blackstock Dr Unit 7456275
- 0 Blackstock Dr Unit 7441539