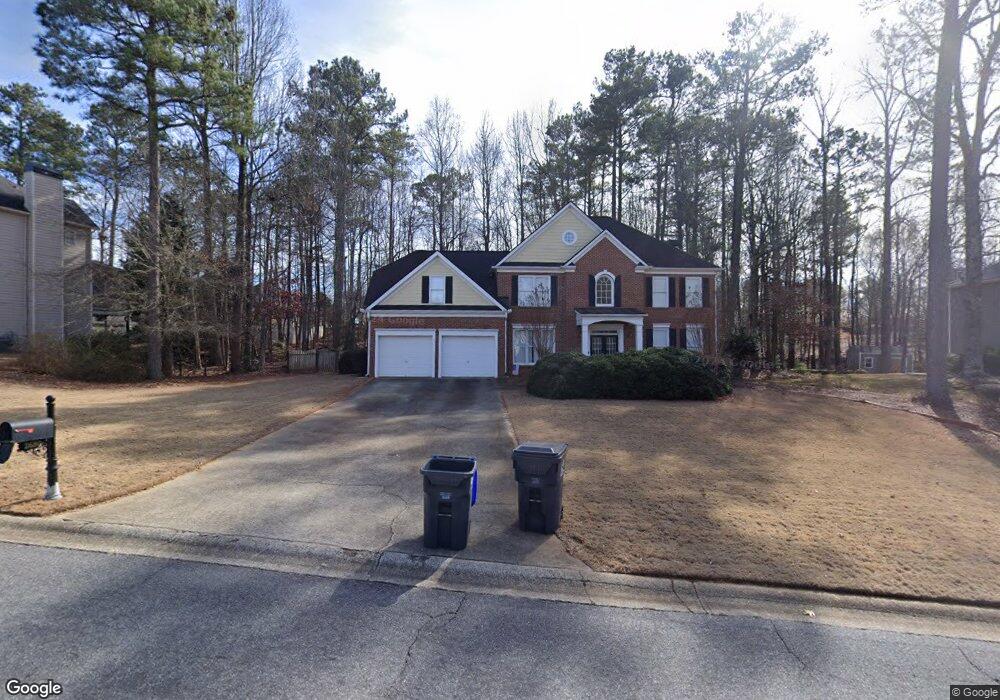
2680 Princeton Trace Cumming, GA 30041
Estimated Value: $628,399 - $708,000
4
Beds
3
Baths
3,164
Sq Ft
$211/Sq Ft
Est. Value
About This Home
This home is located at 2680 Princeton Trace, Cumming, GA 30041 and is currently estimated at $667,600, approximately $210 per square foot. 2680 Princeton Trace is a home located in Forsyth County with nearby schools including Haw Creek Elementary School, Lakeside Middle School, and South Forsyth High School.
Ownership History
Date
Name
Owned For
Owner Type
Purchase Details
Closed on
May 29, 2024
Sold by
Gallina Jack C and Gallina Laurie G
Bought by
Gallina Family Revocable Living Trust and Gallina
Current Estimated Value
Purchase Details
Closed on
Jul 23, 2008
Sold by
Story Todd H and Story Kimberly G
Bought by
Gallina Jack C and Gallina Laurie G
Home Financials for this Owner
Home Financials are based on the most recent Mortgage that was taken out on this home.
Original Mortgage
$234,000
Interest Rate
6.37%
Mortgage Type
New Conventional
Purchase Details
Closed on
Oct 18, 2000
Sold by
Traton Corp Of Gwinnett Inc
Bought by
Story Todd H
Home Financials for this Owner
Home Financials are based on the most recent Mortgage that was taken out on this home.
Original Mortgage
$184,000
Interest Rate
7.94%
Mortgage Type
New Conventional
Create a Home Valuation Report for This Property
The Home Valuation Report is an in-depth analysis detailing your home's value as well as a comparison with similar homes in the area
Home Values in the Area
Average Home Value in this Area
Purchase History
| Date | Buyer | Sale Price | Title Company |
|---|---|---|---|
| Gallina Family Revocable Living Trust | -- | None Listed On Document | |
| Gallina Jack C | $292,500 | -- | |
| Story Todd H | $230,000 | -- |
Source: Public Records
Mortgage History
| Date | Status | Borrower | Loan Amount |
|---|---|---|---|
| Previous Owner | Gallina Jack C | $234,000 | |
| Previous Owner | Story Todd H | $184,000 |
Source: Public Records
Tax History Compared to Growth
Tax History
| Year | Tax Paid | Tax Assessment Tax Assessment Total Assessment is a certain percentage of the fair market value that is determined by local assessors to be the total taxable value of land and additions on the property. | Land | Improvement |
|---|---|---|---|---|
| 2025 | $4,582 | $228,528 | $72,000 | $156,528 |
| 2024 | $4,582 | $229,104 | $60,000 | $169,104 |
| 2023 | $4,022 | $216,320 | $60,000 | $156,320 |
| 2022 | $4,113 | $147,580 | $36,000 | $111,580 |
| 2021 | $3,649 | $147,580 | $36,000 | $111,580 |
| 2020 | $3,523 | $141,472 | $36,000 | $105,472 |
| 2019 | $3,427 | $136,600 | $32,000 | $104,600 |
| 2018 | $3,271 | $128,412 | $28,000 | $100,412 |
| 2017 | $3,077 | $118,608 | $28,000 | $90,608 |
| 2016 | $3,034 | $116,608 | $26,000 | $90,608 |
| 2015 | $2,907 | $110,328 | $24,000 | $86,328 |
| 2014 | $2,689 | $106,780 | $0 | $0 |
Source: Public Records
Map
Nearby Homes
- 2580 New College Way
- 2755 Rustic Lake Terrace
- 2875 New College Way
- 4015 Eyrie Farms Ln
- 2465 Churchill Downs
- 4025 Eyrie Farms Ln
- 2515 Churchill Downs
- 2805 Cambria Ct
- 2530 Vistoria Dr
- 2935 Cobblestone Dr
- 4050 Samples Rd
- 3435 Summit Trail
- 2115 Vistoria Dr
- 3620 Highpoint Rd
- 3875 Sweetwater Dr
- 2850 Roanoke Rd
- 4135 Creekwood Dr
- 2470 Cambridge Hills Rd
- 2575 Maple Park Place
- 2802 Buford Dam Rd
- 2670 Princeton Trace
- 2685 New College Way
- 2675 New College Way
- 2715 New College Way
- 2585 New College Way
- 2570 New College Way
- 2560 New College Way
- 2675 Princeton Trace
- 2690 New College Way
- 2705 Princeton Trace
- 2680 New College Way
- 2725 New College Way
- 2590 New College Way
- 2605 New Rutgers Walk
- 2730 New College Way
- 2575 New College Way
- 2550 New College Way
- 2715 Princeton Trace
- 2720 Princeton Trace
- 2735 New College Way