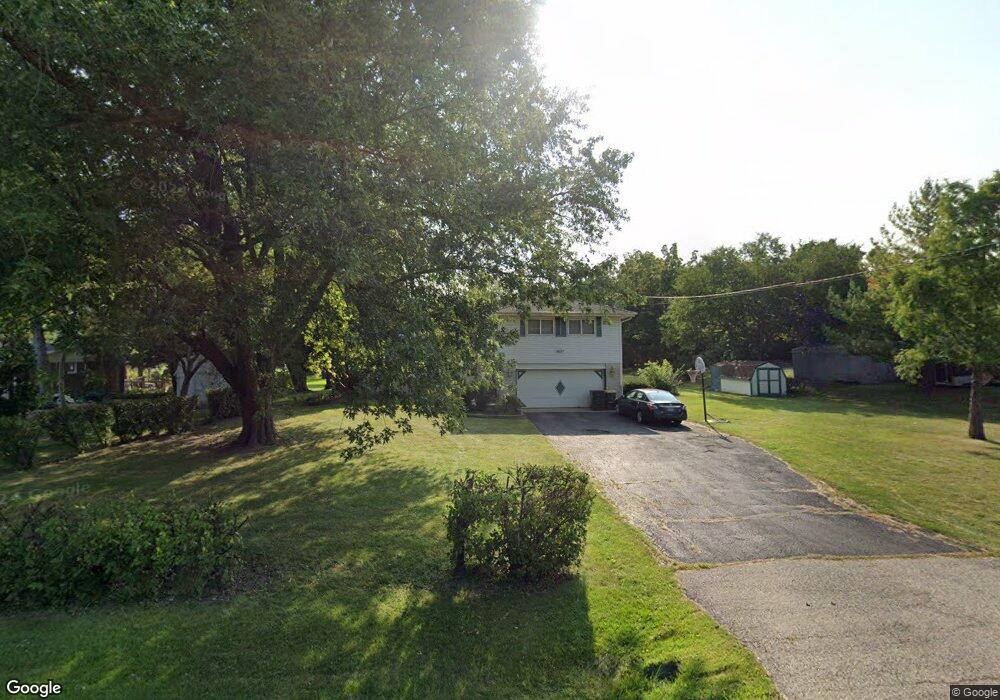
26807 W Nippersink Rd Ingleside, IL 60041
Estimated Value: $354,207 - $449,000
--
Bed
3
Baths
1,883
Sq Ft
$211/Sq Ft
Est. Value
About This Home
This home is located at 26807 W Nippersink Rd, Ingleside, IL 60041 and is currently estimated at $398,052, approximately $211 per square foot. 26807 W Nippersink Rd is a home located in Lake County with nearby schools including Big Hollow Primary School, Big Hollow Elementary School, and Big Hollow Middle School.
Ownership History
Date
Name
Owned For
Owner Type
Purchase Details
Closed on
Dec 12, 2005
Sold by
Jones Patricia A and Burtz Patricia A
Bought by
Jones Patricia A and Patricia A Jones Trust
Current Estimated Value
Purchase Details
Closed on
Aug 30, 2001
Sold by
Campbell James M and Steinbrook Donna C
Bought by
Jones Patricia A
Create a Home Valuation Report for This Property
The Home Valuation Report is an in-depth analysis detailing your home's value as well as a comparison with similar homes in the area
Home Values in the Area
Average Home Value in this Area
Purchase History
| Date | Buyer | Sale Price | Title Company |
|---|---|---|---|
| Jones Patricia A | -- | -- | |
| Jones Patricia A | $245,000 | First American Title |
Source: Public Records
Tax History Compared to Growth
Tax History
| Year | Tax Paid | Tax Assessment Tax Assessment Total Assessment is a certain percentage of the fair market value that is determined by local assessors to be the total taxable value of land and additions on the property. | Land | Improvement |
|---|---|---|---|---|
| 2024 | $4,944 | $104,338 | $26,809 | $77,529 |
| 2023 | $6,120 | $89,767 | $25,256 | $64,511 |
| 2022 | $6,120 | $88,366 | $18,211 | $70,155 |
| 2021 | $6,422 | $83,294 | $17,166 | $66,128 |
| 2020 | $5,682 | $72,953 | $16,922 | $56,031 |
| 2019 | $5,465 | $69,958 | $16,227 | $53,731 |
| 2018 | $6,479 | $80,131 | $20,361 | $59,770 |
| 2017 | $6,123 | $74,065 | $18,820 | $55,245 |
| 2016 | $6,138 | $67,738 | $17,212 | $50,526 |
| 2015 | $5,871 | $63,212 | $16,062 | $47,150 |
| 2014 | $4,384 | $50,381 | $19,632 | $30,749 |
| 2012 | $4,115 | $52,499 | $20,457 | $32,042 |
Source: Public Records
Map
Nearby Homes
- 34052 N Fischer Dr
- 27254 W Nippersink Rd
- 340 Terra Springs Cir
- 2032 Wentworth Dr
- 1855 Alta Dr
- 33703 N Christa Dr
- 545 Blue Springs Dr
- 642 Key Largo Dr Unit 82
- 603 Illinois Route 59
- 250 Annelise Ln
- 26183 W Wooster Lake Ave
- 1519 Prescott Dr
- 160 N Us Highway 12
- 1370 U S 12
- 33336 N Fish Lake Rd
- 34550 N Wilson Rd
- 1247 Waverly Dr Unit 3
- 34382 N Goldenrod Ct Unit 26139
- 247 Red Oak Cir Unit 1401
- 249 Red Oak Cir
- 26787 W Nippersink Rd
- 26815 W Nippersink Rd
- 26761 W Nippersink Rd
- 34105 N Single Oak Ct
- 26839 W Nippersink Rd
- 34142 N Single Oak Ct
- 34137 N Single Oak Ct
- 26851 W Nippersink Rd
- 26753 W Nippersink Rd
- 26846 W Brandenburg Rd
- 34025 N Fischer Dr
- 34049 N Fischer Dr
- 26811 W Brandenburg Rd
- 34057 N Fischer Dr
- 26861 W Nippersink Rd
- 26933 W Carol Ln
- 34169 N Single Oak Ct
- 34200 N Single Oak Ct
- 33979 N Fischer Dr
- 26951 W Carol Ln