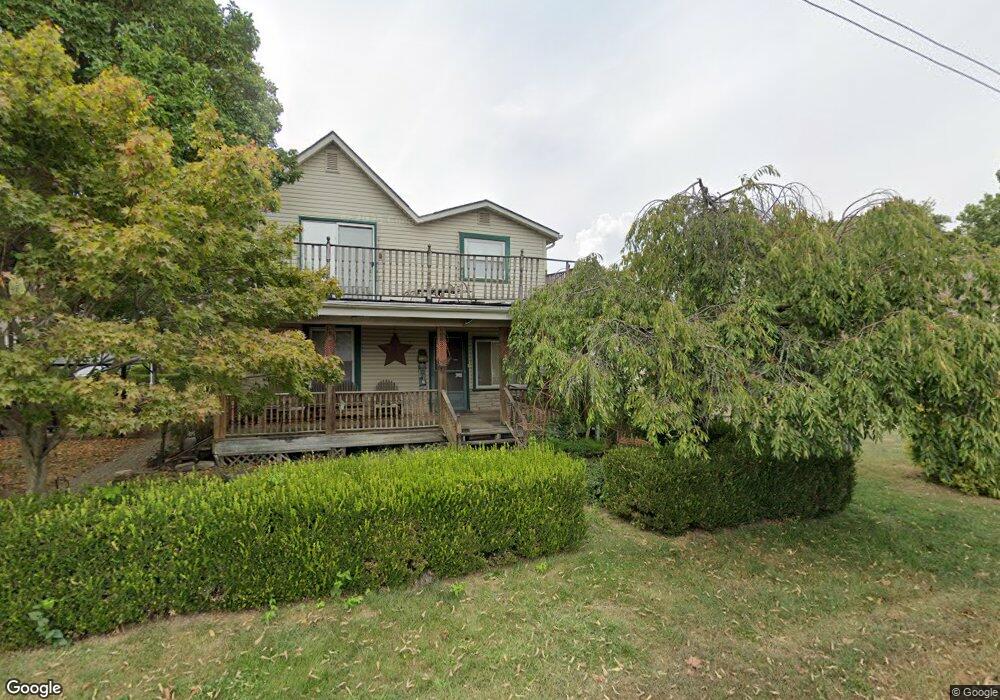
2681 Eastman Ave Columbus, OH 43207
Obetz-Lockbourne NeighborhoodEstimated Value: $193,726 - $219,000
3
Beds
1
Bath
1,558
Sq Ft
$134/Sq Ft
Est. Value
About This Home
This home is located at 2681 Eastman Ave, Columbus, OH 43207 and is currently estimated at $208,182, approximately $133 per square foot. 2681 Eastman Ave is a home located in Franklin County with nearby schools including Parsons Elementary School, Buckeye Middle School, and Marion-Franklin High School.
Ownership History
Date
Name
Owned For
Owner Type
Purchase Details
Closed on
Oct 17, 2003
Sold by
Fletcher Shirley
Bought by
Mcpeek Kevin E and Mcpeek Sandra K
Current Estimated Value
Home Financials for this Owner
Home Financials are based on the most recent Mortgage that was taken out on this home.
Original Mortgage
$65,150
Interest Rate
5.81%
Mortgage Type
Purchase Money Mortgage
Purchase Details
Closed on
Apr 19, 1999
Sold by
Mcpeek Sandra K and Fletcher Sandra
Bought by
Mcpeek Kevin E and Mcpeek Sandra K
Purchase Details
Closed on
Apr 7, 1999
Sold by
Fletcher Kathy Ann
Bought by
Mcpeek Sandra K
Purchase Details
Closed on
Mar 30, 1999
Sold by
Fraley Floeta and Fraley Floella
Bought by
Mcpeek Sandra K
Purchase Details
Closed on
Mar 26, 1999
Sold by
Fletcher Alvis Dean
Bought by
Mcpeek Sandra K
Purchase Details
Closed on
Sep 16, 1987
Purchase Details
Closed on
Mar 1, 1987
Create a Home Valuation Report for This Property
The Home Valuation Report is an in-depth analysis detailing your home's value as well as a comparison with similar homes in the area
Home Values in the Area
Average Home Value in this Area
Purchase History
| Date | Buyer | Sale Price | Title Company |
|---|---|---|---|
| Mcpeek Kevin E | -- | Nations Title Agency Inc | |
| Mcpeek Kevin E | -- | Stewart Title Agency Of Colu | |
| Mcpeek Sandra K | -- | Stewart Title Agency Of Colu | |
| Mcpeek Sandra K | -- | Stewart Title Agency Of Colu | |
| Mcpeek Sandra K | -- | Stewart Title Agency Of Colu | |
| -- | $20,000 | -- | |
| -- | $11,700 | -- |
Source: Public Records
Mortgage History
| Date | Status | Borrower | Loan Amount |
|---|---|---|---|
| Closed | Mcpeek Kevin E | $65,150 |
Source: Public Records
Tax History Compared to Growth
Tax History
| Year | Tax Paid | Tax Assessment Tax Assessment Total Assessment is a certain percentage of the fair market value that is determined by local assessors to be the total taxable value of land and additions on the property. | Land | Improvement |
|---|---|---|---|---|
| 2024 | $2,961 | $65,980 | $12,880 | $53,100 |
| 2023 | $2,923 | $65,975 | $12,880 | $53,095 |
| 2022 | $1,936 | $37,320 | $6,900 | $30,420 |
| 2021 | $1,939 | $37,320 | $6,900 | $30,420 |
| 2020 | $1,942 | $37,320 | $6,900 | $30,420 |
| 2019 | $1,967 | $32,420 | $5,990 | $26,430 |
| 2018 | $1,755 | $32,420 | $5,990 | $26,430 |
| 2017 | $1,966 | $32,420 | $5,990 | $26,430 |
| 2016 | $1,704 | $25,730 | $3,220 | $22,510 |
| 2015 | $1,547 | $25,730 | $3,220 | $22,510 |
| 2014 | $1,551 | $25,730 | $3,220 | $22,510 |
| 2013 | $806 | $27,090 | $3,395 | $23,695 |
Source: Public Records
Map
Nearby Homes
- 19 E Castle Rd
- 202 Calahan Rd
- 84 Betz Rd
- 300 Loxley Dr
- 82 Delray Rd
- 2763 Parsons Ave
- 238 Delray Rd
- 0 Parsons Ave
- 2808 Dolby Dr
- 2901 Parsons Ave
- 115 W Castle Rd
- 162 Phelps Rd
- 2769 Shelly Dr
- 228 Currier Dr
- 3161 Lewis Rd
- 574 Koebel Ave
- 611 Lock Ave
- 1633-1635 E Greenway Ave
- 256 Rumsey Rd Unit 258
- 445 Basswood Rd
- 0 Eastman Ave
- 0 Kail Ave
- 2667 Eastman Ave
- 2691 Eastman Ave
- 114 Kail Ave
- 2668 Eastman Ave
- 2680 Eastman Ave
- 119 Landers Ave
- 0 Landers Ave
- 2703 Eastman Ave
- 2664 Eastman Ave
- 112 Kail Ave
- 115 Kail Ave
- 0 Eastman Ave
- 150 Landers Ave
- 130 Landers Ave
- 2698 Eastman Ave
- 160 Landers Ave
- 128 Landers Ave
- 113 Kail Ave