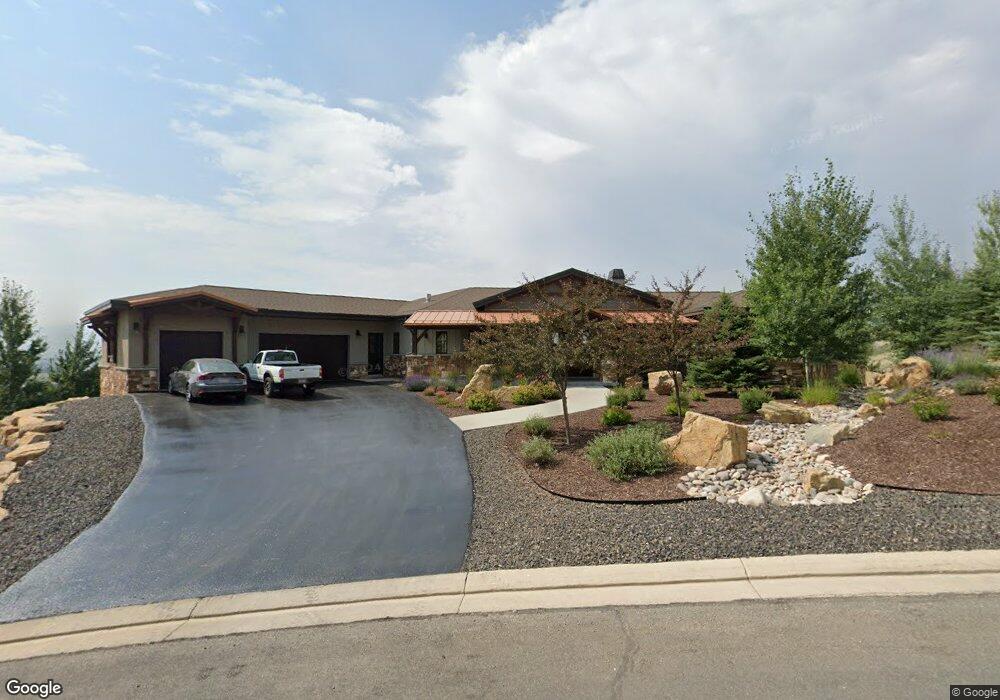
2681 River Meadows Dr Unit 21 Midway, UT 84049
Estimated Value: $4,228,000 - $4,490,000
--
Bed
--
Bath
2,652
Sq Ft
$1,657/Sq Ft
Est. Value
About This Home
This home is located at 2681 River Meadows Dr Unit 21, Midway, UT 84049 and is currently estimated at $4,394,032, approximately $1,656 per square foot. 2681 River Meadows Dr Unit 21 is a home located in Wasatch County with nearby schools including Midway Elementary School, Rocky Mountain Middle School, and Wasatch High School.
Ownership History
Date
Name
Owned For
Owner Type
Purchase Details
Closed on
May 18, 2022
Sold by
Scott Dalebout
Bought by
Shelley Dalebout Trust
Current Estimated Value
Purchase Details
Closed on
Oct 12, 2015
Sold by
Ivory Homes Ltd
Bought by
Dalebout Scott and Dalebout Shelley
Home Financials for this Owner
Home Financials are based on the most recent Mortgage that was taken out on this home.
Original Mortgage
$860,000
Interest Rate
3.78%
Mortgage Type
New Conventional
Purchase Details
Closed on
May 23, 2014
Sold by
Dalebout Scott and Dalebout Shelley
Bought by
Ivory Homes Ltd
Purchase Details
Closed on
Jun 19, 2013
Sold by
Byers William C and Byers Donna S
Bought by
Dalebout Scott and Dalebout Shelley
Purchase Details
Closed on
Apr 20, 2010
Sold by
Wentworth Development Llc
Bought by
Byers William C and Byers Donna S
Create a Home Valuation Report for This Property
The Home Valuation Report is an in-depth analysis detailing your home's value as well as a comparison with similar homes in the area
Home Values in the Area
Average Home Value in this Area
Purchase History
| Date | Buyer | Sale Price | Title Company |
|---|---|---|---|
| Shelley Dalebout Trust | -- | None Listed On Document | |
| Dalebout Scott | -- | Cottonwood Title Ins Agency | |
| Ivory Homes Ltd | -- | Cottonwod Title Ins Agency I | |
| Dalebout Scott | -- | Metro National Title | |
| Byers William C | -- | First American Ncs South Tem |
Source: Public Records
Mortgage History
| Date | Status | Borrower | Loan Amount |
|---|---|---|---|
| Previous Owner | Dalebout Scott | $860,000 |
Source: Public Records
Tax History Compared to Growth
Tax History
| Year | Tax Paid | Tax Assessment Tax Assessment Total Assessment is a certain percentage of the fair market value that is determined by local assessors to be the total taxable value of land and additions on the property. | Land | Improvement |
|---|---|---|---|---|
| 2025 | $11,334 | $2,395,800 | $784,000 | $1,611,800 |
| 2024 | $11,245 | $2,395,800 | $784,000 | $1,611,800 |
| 2023 | $11,245 | $2,528,400 | $609,000 | $1,919,400 |
| 2022 | $8,025 | $1,556,605 | $404,500 | $1,152,105 |
| 2021 | $10,086 | $1,556,605 | $404,500 | $1,152,105 |
| 2020 | $6,760 | $1,010,374 | $329,500 | $680,874 |
| 2019 | $6,120 | $541,418 | $0 | $0 |
| 2018 | $6,340 | $560,872 | $0 | $0 |
| 2017 | $6,334 | $560,872 | $0 | $0 |
| 2016 | $6,274 | $544,372 | $0 | $0 |
| 2015 | $2,715 | $250,000 | $250,000 | $0 |
| 2014 | $2,810 | $250,000 | $250,000 | $0 |
Source: Public Records
Map
Nearby Homes
- 2681 River Meadows Dr
- 2681 N River Meadows Dr
- 2591 River Meadows Ln Unit 19
- 2591 N River Meadows Dr Unit 19
- 4455 N Highway 40
- 110 Moulton Ln
- 110 W Moulton Cir
- 4941 N Hillwood Unit A24
- 538 W Heritage Way
- 5329 N Lauralwood St
- 5329 N Lauralwood St Unit A3
- 9724 S Old Us Highway 189
- 253 St Moritz Rd
- 95 Matterhorn Cir Unit 95
- 245 W Big Matterhorn Cir
- 5993 N Fairview Dr
- 5993 N Fairview Dr Unit 228
- 5999 N Fairview Dr Unit 229
- 5999 N Fairview Dr
- 6003 N Fairview Dr Unit 230
- 2689 River Meadows Dr
- 2689 N River Meadows Dr
- 2699 River Meadows Dr Unit 24
- 2699 River Meadows Dr
- 2699 River Meadows Dr
- 2699 River Meadows Dr
- 2699 River Meadows Dr Unit 23
- 2699 River Meadows Dr Unit 23
- 2670 River Meadows Dr
- 2670 River Meadows Dr Unit 29
- 2654 River Meadows Dr
- 2625 River Meadows Ln Unit 20
- 2625 River Meadows Ln Unit 20
- 2625 River Meadows Ln Unit 20
- 2625 River Meadows Ln
- 2625 River Meadows Ln Unit 20
- 2717 River Meadows Dr
- 2717 River Meadows Dr Unit 24
- 2717 River Meadows Dr
- 2717 River Meadows Dr Unit 24