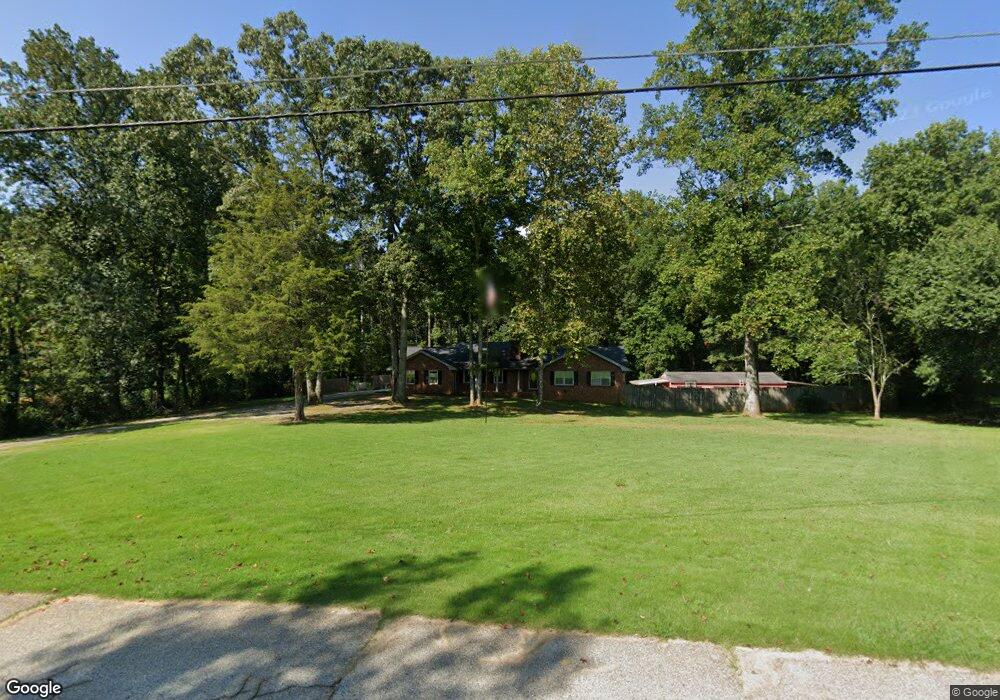
2681 Spring St Dacula, GA 30019
Estimated Value: $358,000 - $404,000
3
Beds
2
Baths
1,785
Sq Ft
$218/Sq Ft
Est. Value
About This Home
This home is located at 2681 Spring St, Dacula, GA 30019 and is currently estimated at $388,815, approximately $217 per square foot. 2681 Spring St is a home located in Gwinnett County with nearby schools including Dacula Elementary School, Dacula Middle School, and Dacula High School.
Ownership History
Date
Name
Owned For
Owner Type
Purchase Details
Closed on
Aug 27, 2018
Sold by
Gibson Harry L
Bought by
Mcilvaine John and Mcilvaine Ashley
Current Estimated Value
Home Financials for this Owner
Home Financials are based on the most recent Mortgage that was taken out on this home.
Original Mortgage
$183,150
Outstanding Balance
$157,361
Interest Rate
4.12%
Mortgage Type
FHA
Estimated Equity
$231,454
Purchase Details
Closed on
Dec 9, 2016
Sold by
Barry G
Bought by
Gibson Ashley L and Gibson Harry L
Home Financials for this Owner
Home Financials are based on the most recent Mortgage that was taken out on this home.
Original Mortgage
$136,000
Interest Rate
3.57%
Mortgage Type
New Conventional
Purchase Details
Closed on
Feb 25, 2002
Sold by
Cheek Barry G
Bought by
Cheek Cynthia G
Home Financials for this Owner
Home Financials are based on the most recent Mortgage that was taken out on this home.
Original Mortgage
$25,200
Interest Rate
6.81%
Mortgage Type
New Conventional
Create a Home Valuation Report for This Property
The Home Valuation Report is an in-depth analysis detailing your home's value as well as a comparison with similar homes in the area
Home Values in the Area
Average Home Value in this Area
Purchase History
| Date | Buyer | Sale Price | Title Company |
|---|---|---|---|
| Mcilvaine John | -- | -- | |
| Gibson Ashley L | -- | -- | |
| Cheek Cynthia G | -- | -- |
Source: Public Records
Mortgage History
| Date | Status | Borrower | Loan Amount |
|---|---|---|---|
| Open | Mcilvaine John | $183,150 | |
| Previous Owner | Gibson Ashley L | $136,000 | |
| Previous Owner | Cheek Cynthia G | $25,200 |
Source: Public Records
Tax History
| Year | Tax Paid | Tax Assessment Tax Assessment Total Assessment is a certain percentage of the fair market value that is determined by local assessors to be the total taxable value of land and additions on the property. | Land | Improvement |
|---|---|---|---|---|
| 2025 | $5,818 | $168,640 | $28,000 | $140,640 |
| 2024 | $5,389 | $154,400 | $31,840 | $122,560 |
| 2023 | $5,389 | $154,400 | $31,840 | $122,560 |
| 2022 | $4,994 | $142,680 | $28,240 | $114,440 |
| 2021 | $4,157 | $97,000 | $19,840 | $77,160 |
| 2020 | $4,181 | $97,000 | $19,840 | $77,160 |
| 2019 | $3,698 | $88,160 | $19,840 | $68,320 |
| 2018 | $3,159 | $88,160 | $19,840 | $68,320 |
| 2016 | $2,266 | $64,000 | $14,040 | $49,960 |
| 2015 | $2,234 | $61,600 | $14,040 | $47,560 |
| 2014 | -- | $56,120 | $14,520 | $41,600 |
Source: Public Records
Map
Nearby Homes
- 2539 Forestdale Dr
- 2538 Forestdale Dr
- 2538 Forest Dale Dr
- 2585 Dacula Ridge Dr
- 1955 William Glen St
- 1904 William Glen St
- 1965 William St
- 1924 William Glen St
- 727 William St
- 2655 Dacula Ridge Dr Unit 2
- 1930 van Alen Ct
- 1920 van Alen Ct
- 1910 van Alen Ct
- 2892 Hill Cir
- 2516 Briar Valley Way
- 2811 Hill Cir
- 762 Harbins Rd
- 652 Secret Garden Ln Unit 58A
- 3195 Eastham Run Dr
- 000 Hog Mountain Church Road and Auburn Rd
- 2671 Spring St
- 2691 Spring St
- 2732 Spring St
- 2701 Spring St
- 2555 Paul Thomas Dr
- 2651 Spring St
- 2615 Spring St
- 2550 Paul Thomas Dr
- 2711 Spring St
- 2641 Spring St
- 2529 Forestdale Dr
- 2565 Paul Thomas Dr
- 2559 Forestdale Dr
- 2549 Forestdale Dr
- 2570 Paul Thomas Dr
- 2631 Spring St
- 2519 Forestdale Dr
- 2632 Spring St
- 2560 Paul Thomas Dr
- 2741 Spring St
Your Personal Tour Guide
Ask me questions while you tour the home.