26811 N Barnett St Magnolia, TX 77355
Estimated Value: $234,000 - $302,000
--
Bed
1
Bath
1,860
Sq Ft
$142/Sq Ft
Est. Value
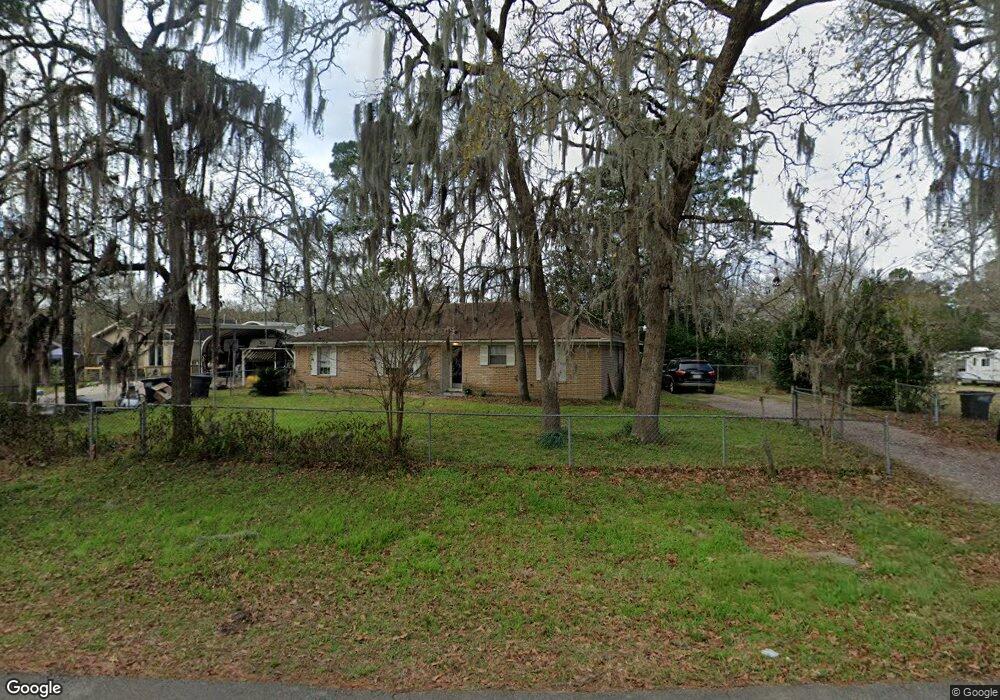
About This Home
This home is located at 26811 N Barnett St, Magnolia, TX 77355 and is currently estimated at $263,847, approximately $141 per square foot. 26811 N Barnett St is a home located in Montgomery County with nearby schools including Nichols Sawmill Elementary School, Magnolia Sixth Grade Campus, and Magnolia Junior High School.
Ownership History
Date
Name
Owned For
Owner Type
Purchase Details
Closed on
Nov 11, 2022
Sold by
Martinez Matthew X and Martinez Lauren Nicole
Bought by
Martinez Esteban Xavier and Martinez Carla Lindsey
Current Estimated Value
Purchase Details
Closed on
Apr 13, 2015
Sold by
Martinez Carla L and Martinez Esteban X
Bought by
Martinez Matthew X
Home Financials for this Owner
Home Financials are based on the most recent Mortgage that was taken out on this home.
Original Mortgage
$102,742
Interest Rate
3.82%
Mortgage Type
New Conventional
Purchase Details
Closed on
May 22, 2012
Sold by
Tuten Evelyn D
Bought by
Martinez Carla L
Purchase Details
Closed on
Mar 18, 2005
Sold by
Tuten Evelyn D
Bought by
Martinez Carla L
Purchase Details
Closed on
Sep 17, 2002
Sold by
Tuten Charles W and Tuten Evelyn D
Bought by
Martinez Esteban X and Martinez Carla L
Create a Home Valuation Report for This Property
The Home Valuation Report is an in-depth analysis detailing your home's value as well as a comparison with similar homes in the area
Home Values in the Area
Average Home Value in this Area
Purchase History
| Date | Buyer | Sale Price | Title Company |
|---|---|---|---|
| Martinez Esteban Xavier | -- | Stewart Title | |
| Martinez Matthew X | -- | Stewart Title | |
| Martinez Carla L | -- | None Available | |
| Martinez Carla L | -- | -- | |
| Martinez Esteban X | -- | Texas American Title Company |
Source: Public Records
Mortgage History
| Date | Status | Borrower | Loan Amount |
|---|---|---|---|
| Previous Owner | Martinez Matthew X | $102,742 |
Source: Public Records
Tax History Compared to Growth
Tax History
| Year | Tax Paid | Tax Assessment Tax Assessment Total Assessment is a certain percentage of the fair market value that is determined by local assessors to be the total taxable value of land and additions on the property. | Land | Improvement |
|---|---|---|---|---|
| 2025 | $3,453 | $181,823 | $71,040 | $110,783 |
| 2024 | $3,442 | $218,141 | $71,040 | $147,101 |
| 2023 | $3,442 | $218,040 | $71,040 | $147,000 |
| 2022 | $2,389 | $135,410 | $71,040 | $90,620 |
| 2021 | $2,288 | $123,100 | $17,760 | $109,830 |
| 2020 | $2,265 | $111,910 | $17,760 | $104,850 |
| 2019 | $2,049 | $101,740 | $17,760 | $94,240 |
| 2018 | $1,507 | $92,490 | $11,370 | $81,120 |
| 2017 | $2,290 | $107,980 | $11,370 | $96,610 |
| 2016 | $2,241 | $105,680 | $6,220 | $99,460 |
| 2015 | $1,516 | $105,680 | $6,220 | $99,460 |
| 2014 | $1,516 | $70,690 | $6,220 | $64,470 |
Source: Public Records
Map
Nearby Homes
- 21242 Natalia Grove
- 26603 N Marek Ln
- 27011 Sunset Dr
- 27114 N Heaton Ln
- 24754 Majestic Cone Ln
- 17910 Sea Turtle Ct
- 26523 S Carrol Ln
- 17503 Heaton Ct
- 26530 S Dogwood Ln
- 27119 Seahorse Ln
- 17819 Indigo Hills Dr
- 17103 Indigo Hills Dr
- 21610 Meadowsweet Dr
- 27141 Nichols Sawmill Rd
- 17447 Country Skies
- 26115 Country Woods Trail
- 26718 Stagecoach Crossing Dr
- 00000 Butera Rd
- 16910 Butera Rd
- 22102 Badger Hollow Dr
- 26807 N Barnett St
- 26815 N Barnett St
- 26806 Sunset Ln
- 26715 N Barnett St
- 26734 N Barnett Ln
- 26714 N Barnett St
- 26718 Sunset Ln
- 26718 N Barnett Ln
- 17707 Winding Creek Ln
- 26815 N Marek Ln
- 26714 Sunset Ln
- 26803 N Marek Ln
- 26711 N Barnett St
- 26811 Sunset Ln
- 24618 Sapling Pine St
- 24666 Sapling Pine St
- 24634 Sapling Pine St
- 24630 Sapling Pine St
- 24622 Sapling Pine St
- 24662 Sapling Pine St