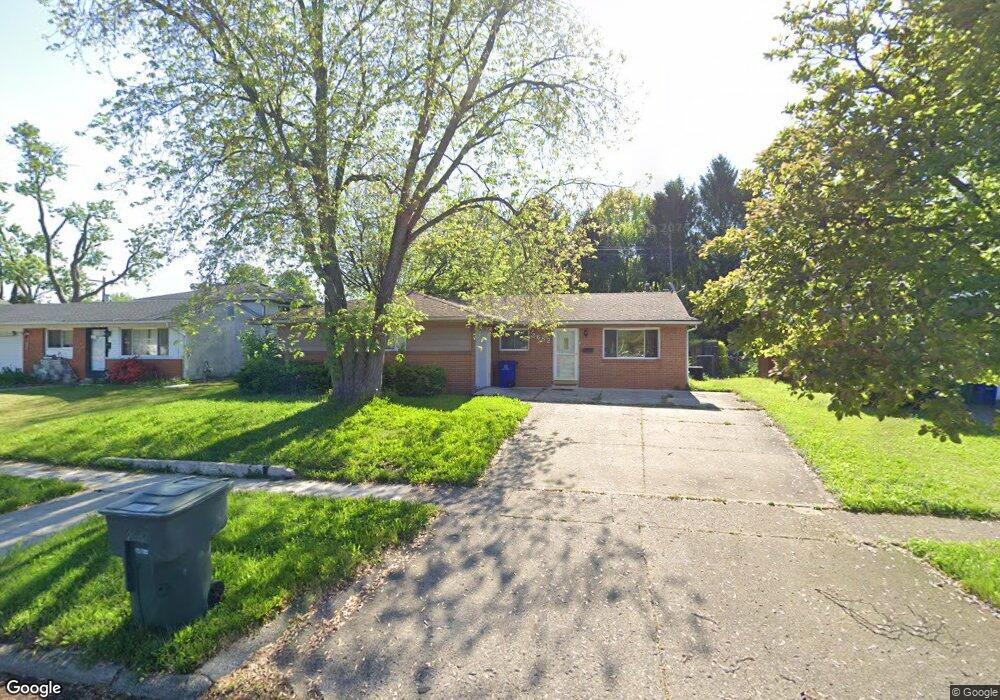
2682 Maywood Rd Columbus, OH 43232
Walnut Heights NeighborhoodEstimated Value: $205,925 - $239,000
3
Beds
1
Bath
1,239
Sq Ft
$179/Sq Ft
Est. Value
About This Home
This home is located at 2682 Maywood Rd, Columbus, OH 43232 and is currently estimated at $222,231, approximately $179 per square foot. 2682 Maywood Rd is a home located in Franklin County with nearby schools including Liberty Elementary School, Yorktown Middle School, and Independence High School.
Ownership History
Date
Name
Owned For
Owner Type
Purchase Details
Closed on
Oct 19, 2017
Sold by
Seawind Properties Ltd
Bought by
Xinixada Xivica Ltd
Current Estimated Value
Purchase Details
Closed on
Feb 21, 2005
Sold by
Warren Joan E
Bought by
Seawind Properties Ltd
Purchase Details
Closed on
Dec 18, 2003
Sold by
Hud
Bought by
Warren Joan E
Home Financials for this Owner
Home Financials are based on the most recent Mortgage that was taken out on this home.
Original Mortgage
$65,400
Interest Rate
5.84%
Mortgage Type
Purchase Money Mortgage
Purchase Details
Closed on
Aug 25, 2003
Sold by
Hoff Richard C and National City Mortgage Co
Bought by
Hud
Purchase Details
Closed on
Jul 31, 1989
Purchase Details
Closed on
Aug 1, 1986
Create a Home Valuation Report for This Property
The Home Valuation Report is an in-depth analysis detailing your home's value as well as a comparison with similar homes in the area
Home Values in the Area
Average Home Value in this Area
Purchase History
| Date | Buyer | Sale Price | Title Company |
|---|---|---|---|
| Xinixada Xivica Ltd | $85,000 | Amerititle Box | |
| Seawind Properties Ltd | -- | -- | |
| Warren Joan E | $63,000 | Lakeside Title & Escrow Agen | |
| Hud | $60,000 | -- | |
| -- | $51,000 | -- | |
| -- | $46,800 | -- |
Source: Public Records
Mortgage History
| Date | Status | Borrower | Loan Amount |
|---|---|---|---|
| Previous Owner | Warren Joan E | $65,400 |
Source: Public Records
Tax History Compared to Growth
Tax History
| Year | Tax Paid | Tax Assessment Tax Assessment Total Assessment is a certain percentage of the fair market value that is determined by local assessors to be the total taxable value of land and additions on the property. | Land | Improvement |
|---|---|---|---|---|
| 2024 | $2,764 | $60,310 | $18,100 | $42,210 |
| 2023 | $2,729 | $60,305 | $18,095 | $42,210 |
| 2022 | $1,598 | $30,070 | $6,620 | $23,450 |
| 2021 | $1,601 | $30,070 | $6,620 | $23,450 |
| 2020 | $1,603 | $30,070 | $6,620 | $23,450 |
| 2019 | $1,548 | $24,890 | $5,530 | $19,360 |
| 2018 | $1,495 | $24,890 | $5,530 | $19,360 |
| 2017 | $1,567 | $24,890 | $5,530 | $19,360 |
| 2016 | $1,586 | $23,350 | $4,590 | $18,760 |
| 2015 | $1,444 | $23,350 | $4,590 | $18,760 |
| 2014 | $1,448 | $23,350 | $4,590 | $18,760 |
| 2013 | $881 | $25,935 | $5,075 | $20,860 |
Source: Public Records
Map
Nearby Homes
- 2706 Maywood Rd
- 5011 Refugee Rd
- 2615 Carbondale Place
- 5137 Holbrook Dr
- 5061 Labelle Dr
- 2705 Denmark Rd
- 5114 Carbondale Dr
- 2150 Noe Bixby Rd
- 2746 Noe Bixby Rd
- 2651 Brownfield Rd
- 5123 Jameson Dr
- 2900 Ronda Rd
- 5268 Carbondale Dr
- 2998 Osgood Rd E
- 5373 Spire Ln
- 5326 Adderley Ave
- 5401 Spire Ln
- 5143 Rutledge Dr N
- 3067 Argonne Ct
- 5377 Bleaker Ave
- 2688 Maywood Rd
- 2674 Maywood Rd
- 2696 Maywood Rd
- 2666 Maywood Rd
- 5007 Holbrook Dr
- 2663 Lindora Place
- 2691 Maywood Rd
- 4950 Downing Dr
- 2656 Maywood Rd
- 2667 Maywood Rd
- 4945 Downing Dr
- 2657 Lindora Place
- 2657 Maywood Rd
- 5015 Holbrook Dr
- 2650 Maywood Rd
- 2720 Maywood Rd
- 4980 Refugee Rd
- 4940 Downing Dr
- 2719 Maywood Rd
- 2653 Maywood Rd