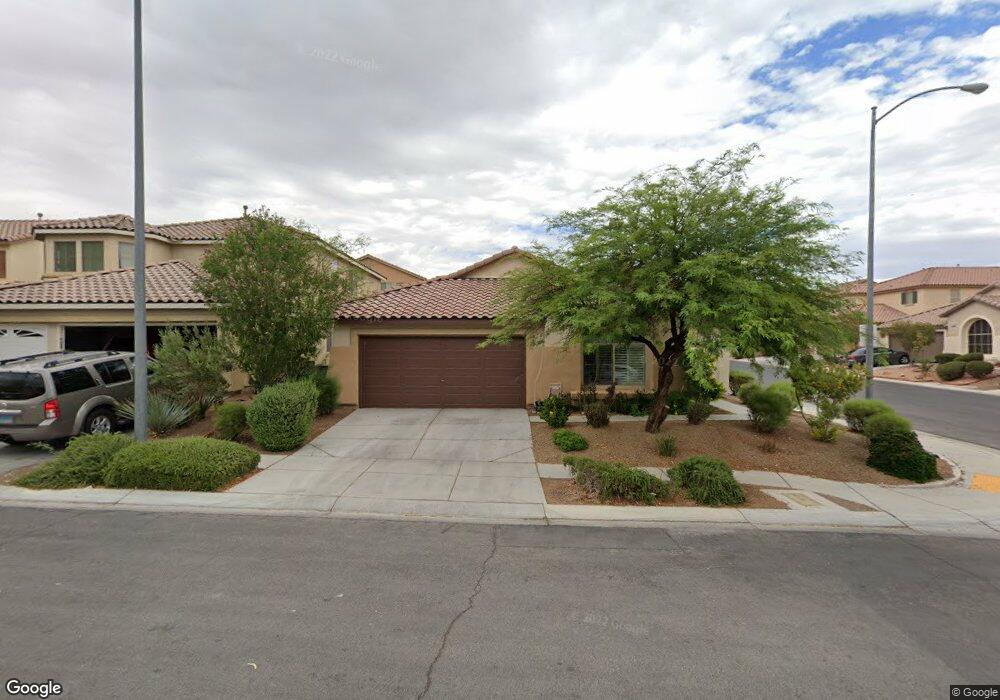
2682 Upland Bluff Dr Las Vegas, NV 89142
Estimated Value: $386,293 - $420,000
3
Beds
2
Baths
1,566
Sq Ft
$260/Sq Ft
Est. Value
About This Home
This home is located at 2682 Upland Bluff Dr, Las Vegas, NV 89142 and is currently estimated at $406,823, approximately $259 per square foot. 2682 Upland Bluff Dr is a home located in Clark County with nearby schools including Jenkins Earl N. Elementary School, Kathleen & Tim Harney Middle School, and Las Vegas High School.
Ownership History
Date
Name
Owned For
Owner Type
Purchase Details
Closed on
Feb 25, 2019
Sold by
Feemster Raulta B and Pursley Daniel K
Bought by
Pursley Raulita B and Pursley Daniel K
Current Estimated Value
Home Financials for this Owner
Home Financials are based on the most recent Mortgage that was taken out on this home.
Original Mortgage
$209,816
Outstanding Balance
$184,464
Interest Rate
4.4%
Mortgage Type
VA
Estimated Equity
$222,359
Purchase Details
Closed on
Sep 24, 2015
Sold by
Pwsley Daniel Keith
Bought by
Pursley Daniel and Pursley Raulita
Purchase Details
Closed on
Mar 13, 2008
Sold by
Pardee Homes Of Nevada
Bought by
Feemster Raulita B and Pursley Daniel K
Home Financials for this Owner
Home Financials are based on the most recent Mortgage that was taken out on this home.
Original Mortgage
$180,000
Interest Rate
5.65%
Mortgage Type
Purchase Money Mortgage
Create a Home Valuation Report for This Property
The Home Valuation Report is an in-depth analysis detailing your home's value as well as a comparison with similar homes in the area
Home Values in the Area
Average Home Value in this Area
Purchase History
| Date | Buyer | Sale Price | Title Company |
|---|---|---|---|
| Pursley Raulita B | -- | Boston National Title Age | |
| Pursley Daniel | -- | None Available | |
| Feemster Raulita B | $241,131 | Chicago Title |
Source: Public Records
Mortgage History
| Date | Status | Borrower | Loan Amount |
|---|---|---|---|
| Open | Pursley Raulita B | $209,816 | |
| Closed | Feemster Raulita B | $180,000 |
Source: Public Records
Tax History Compared to Growth
Tax History
| Year | Tax Paid | Tax Assessment Tax Assessment Total Assessment is a certain percentage of the fair market value that is determined by local assessors to be the total taxable value of land and additions on the property. | Land | Improvement |
|---|---|---|---|---|
| 2025 | $1,508 | $108,224 | $26,950 | $81,274 |
| 2024 | $1,465 | $108,224 | $26,950 | $81,274 |
| 2023 | $1,465 | $106,211 | $29,750 | $76,461 |
| 2022 | $1,422 | $97,150 | $27,300 | $69,850 |
| 2021 | $1,381 | $89,749 | $26,950 | $62,799 |
| 2020 | $1,338 | $86,355 | $21,000 | $65,355 |
| 2019 | $1,299 | $77,671 | $19,250 | $58,421 |
| 2018 | $1,261 | $72,364 | $18,550 | $53,814 |
| 2017 | $1,918 | $65,386 | $15,925 | $49,461 |
| 2016 | $1,315 | $54,542 | $12,775 | $41,767 |
| 2015 | $1,178 | $43,549 | $11,025 | $32,524 |
| 2014 | $1,143 | $43,541 | $7,000 | $36,541 |
Source: Public Records
Map
Nearby Homes
- 2695 Upland Bluff Dr
- 2671 S Colina Bella Ct
- 2593 Indigo Cloud Ct
- 2621 Rainbow River Dr
- 6860 Upland Heights Ave
- 6863 Upland Heights Ave
- 2659 Upland Dawn Ct
- 6679 Chariots Path Ct
- 2676 Upland Dawn Ct
- 2539 Early Light Dr
- 2767 Lindsey Springs St
- 6829 Painted Morning Ave
- 2807 Lindsey Springs St
- 2664 Painted Mist Ct
- 2836 Amphion Ct
- 6471 Dune Point Ct
- 2796 Sipe Springs St
- 6580 Clara Bow Ave Unit 103
- 6578 Charlie Chaplin Ave Unit 102
- 6433 Buck Jones Ave Unit 103
- 2674 Upland Bluff Dr
- 2668 Upland Bluff Dr Unit 406
- 2681 Salida Del Sol Ct
- 2673 Salida Del Sol Ct
- 6731 Lilac Sky Ave
- 6739 Lilac Sky Ave
- 2658 Upland Bluff Dr
- 6747 Lilac Sky Ave
- 2665 Salida Del Sol Ct
- 2683 Upland Bluff Dr
- 2675 Upland Bluff Dr
- 6755 Lilac Sky Ave
- 2667 Upland Bluff Dr
- 2657 Salida Del Sol Ct
- 2650 Upland Bluff Dr
- 2659 Upland Bluff Dr Unit 406
- 2703 Upland Bluff Dr
- 6763 Lilac Sky Ave
- 2649 Salida Del Sol Ct
- 6730 Council Heights Way