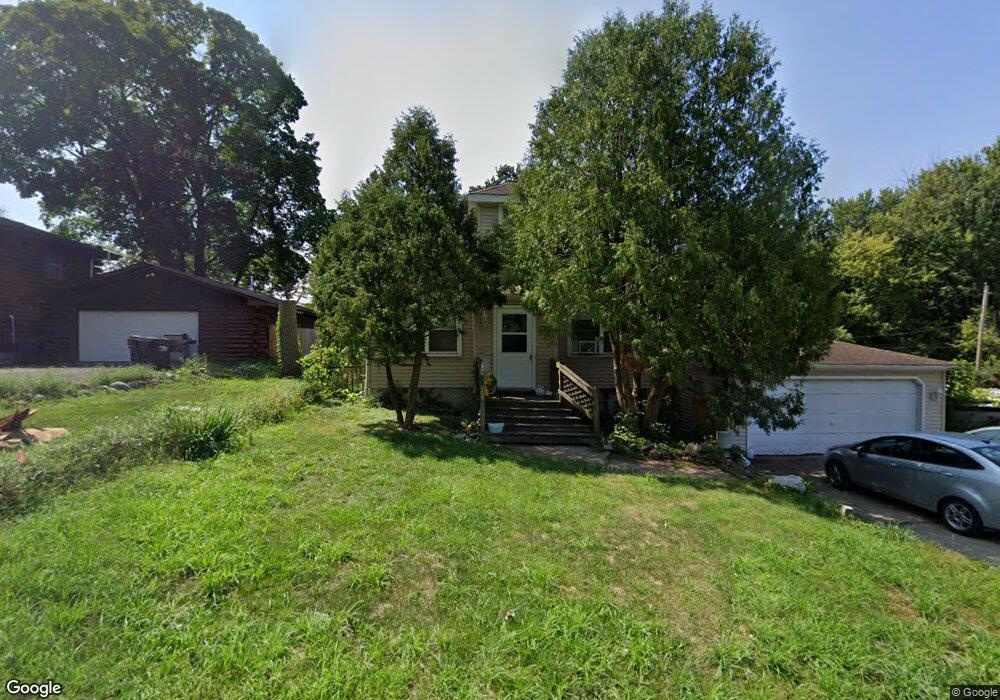
26822 N Ellen St Wauconda, IL 60084
Slocum Lake NeighborhoodEstimated Value: $252,000 - $343,000
4
Beds
2
Baths
1,512
Sq Ft
$195/Sq Ft
Est. Value
About This Home
This home is located at 26822 N Ellen St, Wauconda, IL 60084 and is currently estimated at $295,552, approximately $195 per square foot. 26822 N Ellen St is a home located in Lake County with nearby schools including Cotton Creek School, Matthews Middle School, and Wauconda High School.
Ownership History
Date
Name
Owned For
Owner Type
Purchase Details
Closed on
Feb 22, 2002
Sold by
Cassara Michael P and Cassara Eileen Ruth
Bought by
Johnson Thomas A and Johnson Robin M
Current Estimated Value
Purchase Details
Closed on
Nov 6, 1997
Sold by
Kretschmar Edward
Bought by
Johnson Thomas A and Johnson Robin M
Home Financials for this Owner
Home Financials are based on the most recent Mortgage that was taken out on this home.
Original Mortgage
$112,100
Interest Rate
7.46%
Mortgage Type
FHA
Purchase Details
Closed on
Oct 30, 1997
Sold by
Cassara Michael P
Bought by
Kretchmar Edward A
Home Financials for this Owner
Home Financials are based on the most recent Mortgage that was taken out on this home.
Original Mortgage
$112,100
Interest Rate
7.46%
Mortgage Type
FHA
Purchase Details
Closed on
Feb 10, 1996
Sold by
Cassara Michael P
Bought by
Revocabl Michael P and Revocabl Eileen Ruth Cassara
Create a Home Valuation Report for This Property
The Home Valuation Report is an in-depth analysis detailing your home's value as well as a comparison with similar homes in the area
Home Values in the Area
Average Home Value in this Area
Purchase History
| Date | Buyer | Sale Price | Title Company |
|---|---|---|---|
| Johnson Thomas A | -- | -- | |
| Johnson Thomas A | $113,000 | -- | |
| Kretchmar Edward A | $100,000 | -- | |
| Revocabl Michael P | -- | -- |
Source: Public Records
Mortgage History
| Date | Status | Borrower | Loan Amount |
|---|---|---|---|
| Previous Owner | Johnson Thomas A | $112,100 |
Source: Public Records
Tax History Compared to Growth
Tax History
| Year | Tax Paid | Tax Assessment Tax Assessment Total Assessment is a certain percentage of the fair market value that is determined by local assessors to be the total taxable value of land and additions on the property. | Land | Improvement |
|---|---|---|---|---|
| 2024 | $3,128 | $50,809 | $6,188 | $44,621 |
| 2023 | $2,900 | $46,443 | $5,656 | $40,787 |
| 2022 | $2,900 | $38,094 | $4,211 | $33,883 |
| 2021 | $2,751 | $35,995 | $3,979 | $32,016 |
| 2020 | $2,640 | $34,307 | $3,792 | $30,515 |
| 2019 | $2,293 | $32,423 | $3,584 | $28,839 |
| 2018 | $1,840 | $25,418 | $4,250 | $21,168 |
| 2017 | $1,861 | $25,124 | $4,201 | $20,923 |
| 2016 | $1,730 | $23,791 | $3,978 | $19,813 |
| 2015 | $1,612 | $21,841 | $3,652 | $18,189 |
| 2014 | $3,468 | $35,839 | $12,797 | $23,042 |
| 2012 | $3,390 | $41,326 | $12,243 | $29,083 |
Source: Public Records
Map
Nearby Homes
- 26824 N Poplar St
- 26822 N Ada St
- 26958 N Ellen St
- 28406 W Park Ave
- 26814 N Genesee St
- 28373 W Main St
- 28379 W Main St
- 26769 N Genesee St
- 28490 W Main St
- 26605 N Brooks St
- 1102 Noble Pkwy
- 29460 Roberts Rd
- 28965 W Roberts Rd
- 108 Poplar St
- 327 Garrison Cir
- 4410 Shooting Star Ct
- 515 Normandy Ln
- 27405 N Roberts Ln
- 26215 N Geraldine Ln
- 27569 N Beech St
- 26834 N Ellen St
- 26802 N Ellen St
- 26827 N Ellen St
- 26821 N Ellen St
- 26794 N Ellen St
- 26859 N Ellen St
- 26803 N Ellen St
- 26818 W Maple Ave
- 26781 N Ellen St
- 28442 W Main St
- 28473 W Maple Ave
- 28489 W Maple Ave
- 26780 N Bernice St
- 26823 N Poplar St
- 26837 N Poplar St
- 26805 Bernice St
- 28517 W Maple Ave
- 28433 W Maple Ave
- 28521 W Main St
- 26781 N Bernice St