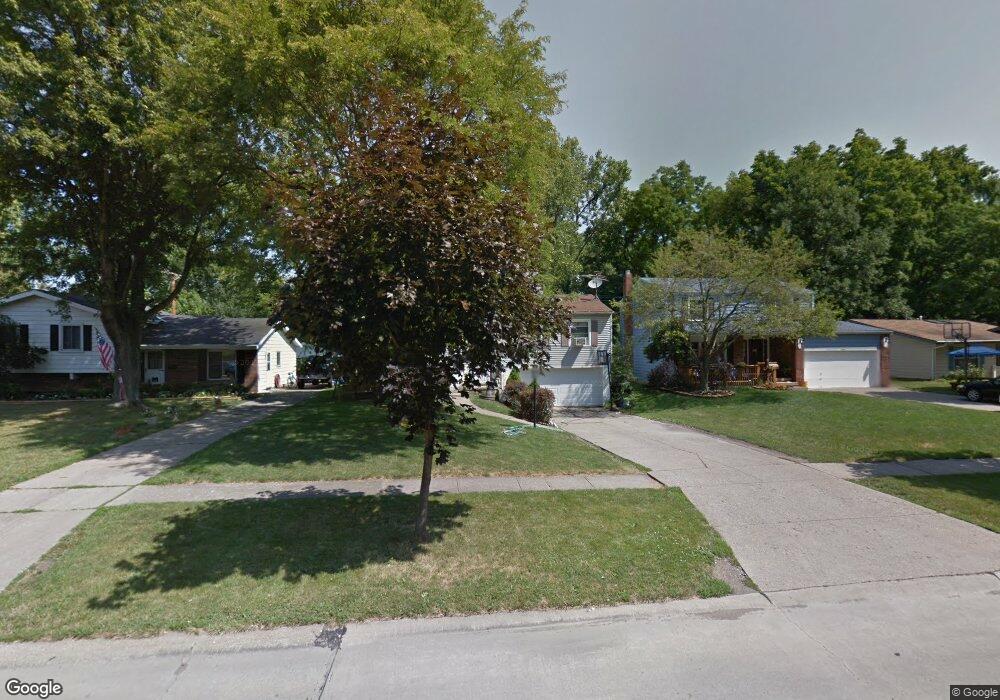
26828 Redwood Dr Olmsted Falls, OH 44138
Estimated Value: $264,000 - $289,000
4
Beds
2
Baths
1,488
Sq Ft
$183/Sq Ft
Est. Value
About This Home
This home is located at 26828 Redwood Dr, Olmsted Falls, OH 44138 and is currently estimated at $272,656, approximately $183 per square foot. 26828 Redwood Dr is a home located in Cuyahoga County with nearby schools including Falls-Lenox Primary Elementary School, Olmsted Falls Intermediate Building, and Olmsted Falls Middle School.
Ownership History
Date
Name
Owned For
Owner Type
Purchase Details
Closed on
Apr 4, 1995
Sold by
Simon Mark
Bought by
Bernaciak Diane M and Simon Matthew
Current Estimated Value
Home Financials for this Owner
Home Financials are based on the most recent Mortgage that was taken out on this home.
Original Mortgage
$111,500
Interest Rate
8.91%
Mortgage Type
New Conventional
Purchase Details
Closed on
Jun 10, 1993
Sold by
Berchin Andrew R
Bought by
Simon Mark
Purchase Details
Closed on
Aug 31, 1987
Sold by
Mcclelland Grover E
Bought by
Berchin Andrew R
Purchase Details
Closed on
Aug 22, 1979
Sold by
Case Ruth
Bought by
Mcclelland Grover E
Purchase Details
Closed on
Nov 10, 1976
Sold by
Turner Edward C
Bought by
Case Ruth
Purchase Details
Closed on
Jan 1, 1975
Bought by
Turner Edward C
Create a Home Valuation Report for This Property
The Home Valuation Report is an in-depth analysis detailing your home's value as well as a comparison with similar homes in the area
Home Values in the Area
Average Home Value in this Area
Purchase History
| Date | Buyer | Sale Price | Title Company |
|---|---|---|---|
| Bernaciak Diane M | $117,500 | -- | |
| Simon Mark | $92,000 | -- | |
| Berchin Andrew R | $65,000 | -- | |
| Mcclelland Grover E | $61,500 | -- | |
| Case Ruth | $46,500 | -- | |
| Turner Edward C | -- | -- |
Source: Public Records
Mortgage History
| Date | Status | Borrower | Loan Amount |
|---|---|---|---|
| Closed | Bernaciak Diane M | $111,500 |
Source: Public Records
Tax History Compared to Growth
Tax History
| Year | Tax Paid | Tax Assessment Tax Assessment Total Assessment is a certain percentage of the fair market value that is determined by local assessors to be the total taxable value of land and additions on the property. | Land | Improvement |
|---|---|---|---|---|
| 2024 | $6,499 | $89,390 | $14,945 | $74,445 |
| 2023 | $5,257 | $55,940 | $13,270 | $42,670 |
| 2022 | $4,455 | $55,930 | $13,265 | $42,665 |
| 2021 | $4,411 | $55,930 | $13,270 | $42,670 |
| 2020 | $3,990 | $44,730 | $10,610 | $34,130 |
| 2019 | $3,543 | $127,800 | $30,300 | $97,500 |
| 2018 | $3,560 | $44,730 | $10,610 | $34,130 |
| 2017 | $3,560 | $41,590 | $8,650 | $32,940 |
| 2016 | $3,541 | $41,590 | $8,650 | $32,940 |
| 2015 | $3,622 | $41,590 | $8,650 | $32,940 |
| 2014 | $3,622 | $41,590 | $8,650 | $32,940 |
Source: Public Records
Map
Nearby Homes
- 26700 Redwood Dr
- V/L Usher Rd
- 9159 E Windsor Dr
- 26609 N Park Blvd Unit 26609
- 26511 Locust Dr
- 26523 Sussex Dr
- 9112 Devonshire Dr
- 26645 Lake of the Falls Blvd
- 9947 Magnolia Dr Unit 14
- 26187 Raintree Blvd Unit C5
- 31100 Blooming Ln
- 26183 Raintree Blvd Unit C-10
- 26179 Raintree Blvd Unit D8
- 27056 Sprague Rd
- 26788 Skyline Dr
- 9430 Columbia Rd
- 29 Carl Ln
- 9190 Waterfall Dr
- 9180 Waterfall Dr
- Caroline Plan at Falls Landing - Villas
- 26812 Redwood Dr
- 26844 Redwood Dr
- 26796 Redwood Dr
- 26860 Redwood Dr
- 26780 Redwood Dr
- 26886 Redwood Dr
- 26829 Redwood Dr
- 26813 Redwood Dr
- 26845 Redwood Dr
- 26764 Redwood Dr
- 26898 Redwood Dr
- 26861 Redwood Dr
- 26781 Redwood Dr
- 26748 Redwood Dr
- 26885 Redwood Dr
- 26749 Redwood Dr
- 26897 Redwood Dr
- 26732 Redwood Dr
- 26800 Locust Dr
- 26818 Locust Dr