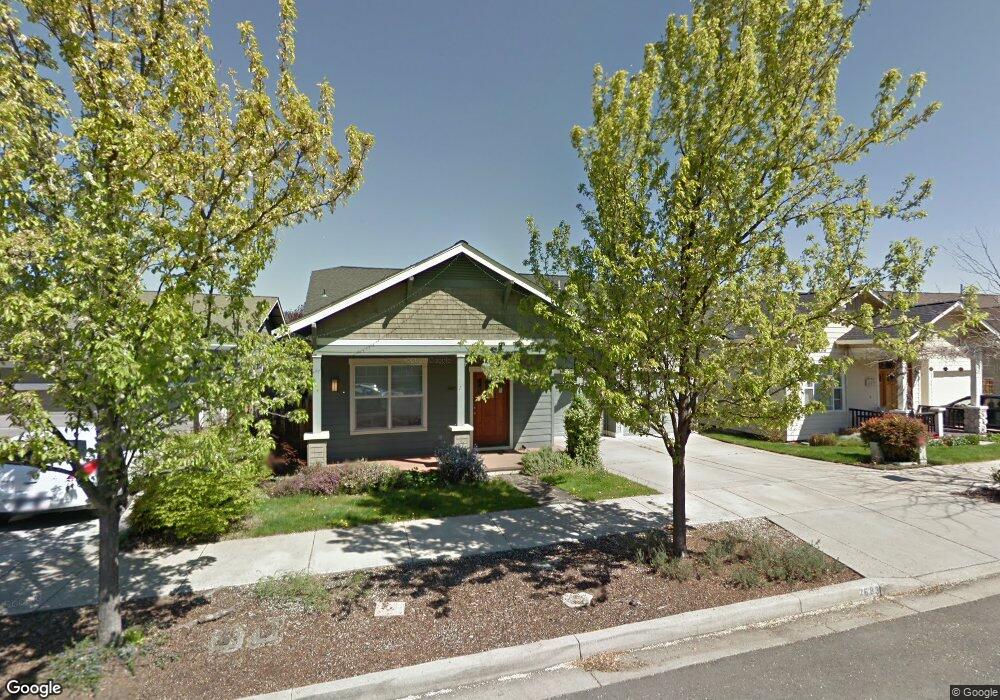
2683 Takelma Way Ashland, OR 97520
South Ashland NeighborhoodEstimated Value: $562,926 - $620,000
3
Beds
3
Baths
2,023
Sq Ft
$296/Sq Ft
Est. Value
About This Home
This home is located at 2683 Takelma Way, Ashland, OR 97520 and is currently estimated at $598,232, approximately $295 per square foot. 2683 Takelma Way is a home located in Jackson County with nearby schools including Bellview Elementary School, Ashland Middle School, and Ashland High School.
Ownership History
Date
Name
Owned For
Owner Type
Purchase Details
Closed on
Oct 27, 2017
Sold by
Blue Jesse and Blue Deborah
Bought by
Shohet Cecile
Current Estimated Value
Purchase Details
Closed on
Jun 6, 2006
Sold by
Hernandez Jill D
Bought by
Blue Jesse and Blue Deborah
Home Financials for this Owner
Home Financials are based on the most recent Mortgage that was taken out on this home.
Original Mortgage
$351,900
Interest Rate
6%
Mortgage Type
Purchase Money Mortgage
Purchase Details
Closed on
Jun 15, 2000
Sold by
Cochrane Charles A and Cochrane Construction
Bought by
Hernandez Jill D
Home Financials for this Owner
Home Financials are based on the most recent Mortgage that was taken out on this home.
Original Mortgage
$40,000
Interest Rate
8.27%
Create a Home Valuation Report for This Property
The Home Valuation Report is an in-depth analysis detailing your home's value as well as a comparison with similar homes in the area
Home Values in the Area
Average Home Value in this Area
Purchase History
| Date | Buyer | Sale Price | Title Company |
|---|---|---|---|
| Shohet Cecile | $430,000 | Amerititle | |
| Blue Jesse | $439,900 | Lawyers Title Ins | |
| Hernandez Jill D | $240,000 | Jackson County Title |
Source: Public Records
Mortgage History
| Date | Status | Borrower | Loan Amount |
|---|---|---|---|
| Previous Owner | Blue Jesse | $351,900 | |
| Previous Owner | Hernandez Jill D | $40,000 |
Source: Public Records
Tax History Compared to Growth
Tax History
| Year | Tax Paid | Tax Assessment Tax Assessment Total Assessment is a certain percentage of the fair market value that is determined by local assessors to be the total taxable value of land and additions on the property. | Land | Improvement |
|---|---|---|---|---|
| 2025 | $6,554 | $422,750 | $108,820 | $313,930 |
| 2024 | $6,554 | $410,440 | $105,650 | $304,790 |
| 2023 | $6,341 | $398,490 | $102,580 | $295,910 |
| 2022 | $6,138 | $398,490 | $102,580 | $295,910 |
| 2021 | $5,929 | $386,890 | $99,590 | $287,300 |
| 2020 | $5,762 | $375,630 | $96,700 | $278,930 |
| 2019 | $5,671 | $354,070 | $91,140 | $262,930 |
| 2018 | $5,357 | $343,760 | $88,490 | $255,270 |
| 2017 | $5,318 | $343,760 | $88,490 | $255,270 |
| 2016 | $5,180 | $324,030 | $83,400 | $240,630 |
| 2015 | $4,868 | $324,030 | $83,400 | $240,630 |
| 2014 | $4,718 | $305,440 | $78,620 | $226,820 |
Source: Public Records
Map
Nearby Homes
- 2663 Takelma Way
- 700 Clay St
- 0 Tolman Cr Rd Unit 220204970
- 775 Tolman Creek Rd
- 876 - 878 Clay St
- 750 Park St
- 740 Park St
- 510 Washington St
- 635 Park St
- 802 Park St Unit 802
- 2969 Barbara St
- 794 Park St Unit 794
- 295 Tolman Creek Rd Unit 1
- 694 Normal Ave
- 582 Washington St
- 2130 Siskiyou Blvd
- 2299 Siskiyou Blvd Unit 13
- 2249 Siskiyou Blvd
- 906 Mary Jane Ave
- 2287 Siskiyou Blvd Unit 7
- 2685 Takelma Way
- 2689 Takelma Way
- 2679 Takelma Way
- 2693 Takelma Way
- 2684 Clay Creek Way
- 2688 Clay Creek Way
- 2680 Clay Creek Way
- 2686 Takelma Way
- 2673 Takelma Way
- 2690 Takelma Way
- 2682 Takelma Way
- 2669 Takelma Way
- 2692 Clay Creek Way
- 2675 Takelma Way
- 2697 Takelma Way
- 2694 Takelma Way
- 2680 Takelma Way
- 2698 Takelma Way
- 635 Jaquelyn St
- 2696 Clay Creek Way