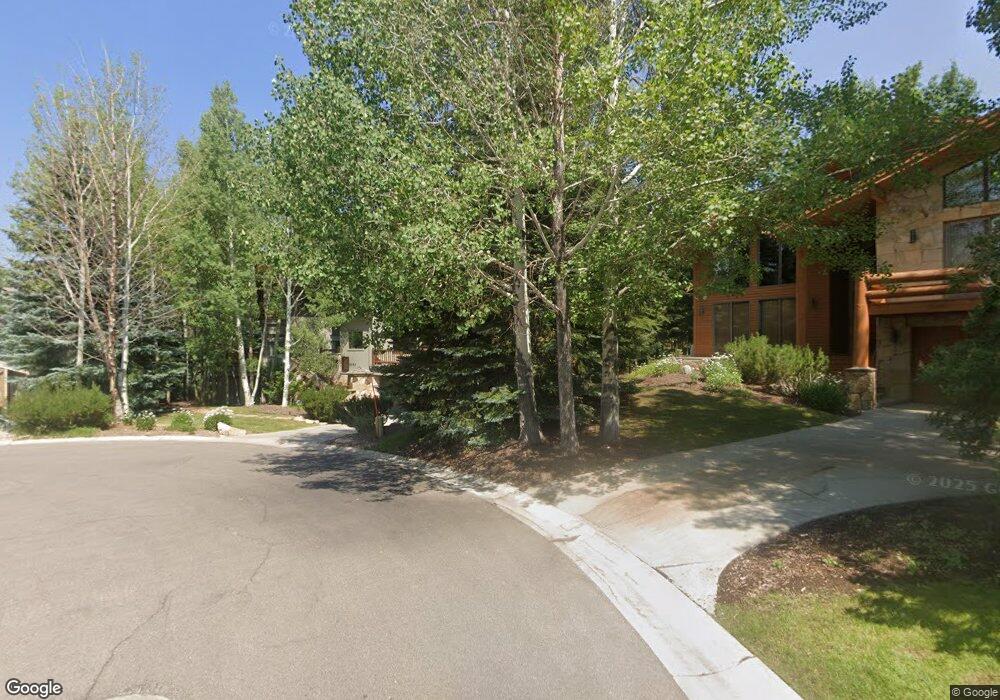
2685 Daystar Cir Unit 31 Park City, UT 84060
Deer Valley NeighborhoodEstimated Value: $4,257,000 - $4,557,000
6
Beds
7
Baths
7,093
Sq Ft
$619/Sq Ft
Est. Value
About This Home
This home is located at 2685 Daystar Cir Unit 31, Park City, UT 84060 and is currently estimated at $4,388,769, approximately $618 per square foot. 2685 Daystar Cir Unit 31 is a home located in Summit County with nearby schools including McPolin Elementary School, Treasure Mountain Junior High School, and Ecker Hill Middle School.
Ownership History
Date
Name
Owned For
Owner Type
Purchase Details
Closed on
Nov 14, 2024
Sold by
Grosse May 24 2002 Family Trust and Grosse Russell W
Bought by
Russell W Grosse And Mary E Grosse Family Tru and Grosse
Current Estimated Value
Purchase Details
Closed on
Nov 5, 2024
Sold by
Mooney Grosse William
Bought by
Grosse 2005 Trust and Grosse
Purchase Details
Closed on
May 4, 2023
Sold by
Grosse Mary Elanore
Bought by
Grosse May 24 2002 Family Trust
Purchase Details
Closed on
Jul 2, 2005
Sold by
Grady Thomas R and Grady Ann G
Bought by
Grosse Mary E
Home Financials for this Owner
Home Financials are based on the most recent Mortgage that was taken out on this home.
Original Mortgage
$680,000
Interest Rate
5.87%
Mortgage Type
Adjustable Rate Mortgage/ARM
Create a Home Valuation Report for This Property
The Home Valuation Report is an in-depth analysis detailing your home's value as well as a comparison with similar homes in the area
Home Values in the Area
Average Home Value in this Area
Purchase History
| Date | Buyer | Sale Price | Title Company |
|---|---|---|---|
| Russell W Grosse And Mary E Grosse Family Tru | -- | None Listed On Document | |
| Hyatt Family Trust | -- | None Listed On Document | |
| Russell W Grosse And Mary E Grosse Family Tru | -- | None Listed On Document | |
| Grosse 2005 Trust | -- | None Listed On Document | |
| Grosse 2005 Trust | -- | None Listed On Document | |
| Grosse May 24 2002 Family Trust | -- | None Listed On Document | |
| Grosse Mary E | -- | None Available |
Source: Public Records
Mortgage History
| Date | Status | Borrower | Loan Amount |
|---|---|---|---|
| Previous Owner | Grosse Mary E | $680,000 |
Source: Public Records
Tax History Compared to Growth
Tax History
| Year | Tax Paid | Tax Assessment Tax Assessment Total Assessment is a certain percentage of the fair market value that is determined by local assessors to be the total taxable value of land and additions on the property. | Land | Improvement |
|---|---|---|---|---|
| 2024 | $18,860 | $3,911,929 | $700,000 | $3,211,929 |
| 2023 | $18,860 | $3,345,118 | $700,000 | $2,645,118 |
| 2022 | $19,545 | $2,967,244 | $700,000 | $2,267,244 |
| 2021 | $18,200 | $2,388,433 | $688,000 | $1,700,433 |
| 2020 | $15,499 | $1,916,091 | $688,000 | $1,228,091 |
| 2019 | $15,773 | $1,916,091 | $688,000 | $1,228,091 |
| 2018 | $15,773 | $1,916,091 | $688,000 | $1,228,091 |
| 2017 | $14,245 | $1,821,622 | $688,000 | $1,133,622 |
| 2016 | $14,635 | $1,821,622 | $688,000 | $1,133,622 |
| 2015 | $14,646 | $1,727,154 | $0 | $0 |
| 2013 | $15,710 | $1,727,154 | $0 | $0 |
Source: Public Records
Map
Nearby Homes
- 2685 Daystar Cir
- 2510 Queen Esther Dr
- 2442 Deer Lake Dr
- 3506 Oak Wood Dr
- 3460 Sun Ridge Dr
- 3506 Oakwood Dr
- 2385 Good Trump Ct
- 2364 Gilt Edge Cir Unit 12
- 3495 Sun Ridge Dr
- 1955 Deer Valley Dr N Unit 302
- 1955 Deer Valley Dr N Unit 403
- 2305 Queen Esther Dr Unit 201
- 1450 Deer Valley Dr N
- 75 Hidden Oaks Ln
- 2900 Deer Valley Dr E Unit B311
- 1612 Deer Valley Dr N
- 1365 Pinnacle Dr
- 1582 Deer Valley Dr N
- 1574 Deer Valley Dr N
- 2675 Daystar Cir
- 2680 Daystar Cir
- 1769 Daystar Cir Unit 1769
- 1757 Daystar Cir Unit 1757
- 1781 Daystar Cir Unit 1781
- 1733 Daystar Cir Unit 1733
- 1853 Daystar Cir Unit 1853
- 1841 Daystar Cir Unit 1841
- 1745 Daystar Cir Unit 1745
- 1805 Daystar Cir Unit 1805
- 2680 Telemark Dr
- 2665 Daystar Cir
- 2675 Telemark Dr
- 2755 Telemark Dr Unit 35
- 2755 Telemark Dr
- 2790 Eladar Place
- 2785 Telemark Dr
- 2715 Telemark Dr
- 1870 Daystar Cir Unit 1870
- 1798 Daystar Cir Unit 1798