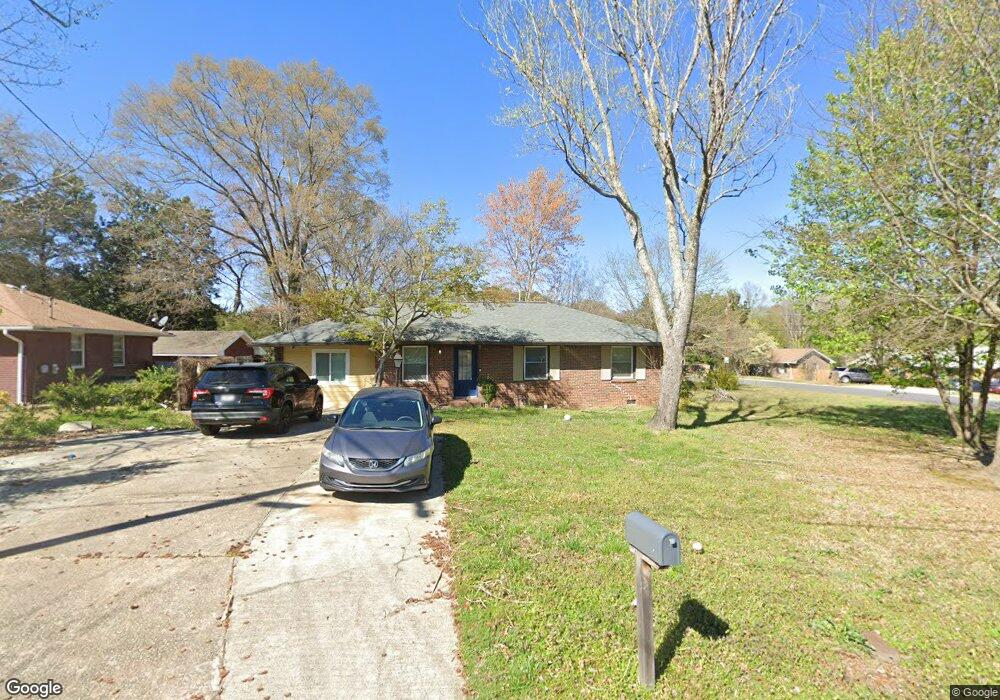
2685 Tabor Ct Morrow, GA 30260
Estimated Value: $179,226 - $261,000
3
Beds
2
Baths
1,166
Sq Ft
$191/Sq Ft
Est. Value
About This Home
This home is located at 2685 Tabor Ct, Morrow, GA 30260 and is currently estimated at $222,807, approximately $191 per square foot. 2685 Tabor Ct is a home located in Clayton County with nearby schools including Thurgood Marshall Elementary School, Morrow Middle School, and Morrow High School.
Ownership History
Date
Name
Owned For
Owner Type
Purchase Details
Closed on
Oct 30, 2020
Sold by
Graves Antonio
Bought by
Mata Marco Antonio and Mata Dayanara Abigail
Current Estimated Value
Home Financials for this Owner
Home Financials are based on the most recent Mortgage that was taken out on this home.
Original Mortgage
$155,200
Outstanding Balance
$136,316
Interest Rate
2.8%
Mortgage Type
New Conventional
Estimated Equity
$86,491
Purchase Details
Closed on
Jun 18, 2020
Sold by
Tds Holdings Llc
Bought by
Graves Antonio
Purchase Details
Closed on
Feb 1, 2019
Sold by
Lopes Ricardo
Bought by
Peach Perfect Solutions Llc
Purchase Details
Closed on
Aug 7, 2018
Sold by
Comerford Barry
Bought by
Lopes Ricardo
Purchase Details
Closed on
Mar 28, 2013
Sold by
Comerford Joy Sherron
Bought by
Comerford Barry
Create a Home Valuation Report for This Property
The Home Valuation Report is an in-depth analysis detailing your home's value as well as a comparison with similar homes in the area
Home Values in the Area
Average Home Value in this Area
Purchase History
| Date | Buyer | Sale Price | Title Company |
|---|---|---|---|
| Mata Marco Antonio | $160,000 | -- | |
| Graves Antonio | $48,500 | -- | |
| Tds Holdings Llc | $30,000 | -- | |
| Peach Perfect Solutions Llc | -- | -- | |
| Lopes Ricardo | $13,000 | -- | |
| Comerford Barry | -- | -- |
Source: Public Records
Mortgage History
| Date | Status | Borrower | Loan Amount |
|---|---|---|---|
| Open | Mata Marco Antonio | $155,200 |
Source: Public Records
Tax History
| Year | Tax Paid | Tax Assessment Tax Assessment Total Assessment is a certain percentage of the fair market value that is determined by local assessors to be the total taxable value of land and additions on the property. | Land | Improvement |
|---|---|---|---|---|
| 2025 | $3,517 | $63,440 | $7,200 | $56,240 |
| 2024 | $3,994 | $111,480 | $7,200 | $104,280 |
| 2023 | $3,791 | $105,000 | $7,200 | $97,800 |
| 2022 | $2,564 | $74,440 | $7,200 | $67,240 |
| 2021 | $2,016 | $60,160 | $7,200 | $52,960 |
| 2020 | $648 | $15,337 | $7,200 | $8,137 |
| 2019 | $986 | $23,428 | $6,400 | $17,028 |
| 2018 | $242 | $21,772 | $6,400 | $15,372 |
| 2017 | $377 | $27,472 | $6,400 | $21,072 |
| 2016 | $302 | $23,972 | $6,400 | $17,572 |
| 2015 | $364 | $0 | $0 | $0 |
| 2014 | $267 | $23,458 | $6,400 | $17,058 |
Source: Public Records
Map
Nearby Homes
- 6205 Fieldcrest Dr
- 2567 Creston Way
- 6200 Fieldcrest Dr Unit 3
- 2280 Santa fe St Unit 17
- 2306 Santa fe St Unit 9
- 2717 Shelley Ln
- 6068 Mount Zion Blvd
- 6227 Mount Zion Blvd
- 2731 Lynn Ct
- 6082 Kathie Ct
- 2756 Kathie Ln
- 5986 Mount Zion Blvd
- 6203 Castlewood Dr
- 2815 Teal Landing Dr
- 2391 Prestige Valley Ct
- 2509 Bonita Ct
- 2455 Lake Harbin Rd
- 2497 Celina Ct
- 6380 Mount Zion Blvd
- 6050 Randy Ln
- 6111 Monica Dr
- 2576 Tabor Ct
- 6135 Monica Dr
- 6116 Monica Dr
- 6099 Monica Dr
- 2577 Daley Ct
- 2570 Tabor Ct
- 6136 Monica Dr
- 2571 Tabor Ct
- 6104 Monica Dr
- 2573 Daley Ct Unit 4
- 6128 Tabor Ave Unit IV
- 6149 Monica Dr
- 2566 Tabor Ct
- 6117 Tabor Ave
- 2567 Tabor Ct
- 6124 Tabor Ave
- 6647 Dan Dr
- 6096 Monica Dr
- 2563 Tabor Ct
Your Personal Tour Guide
Ask me questions while you tour the home.