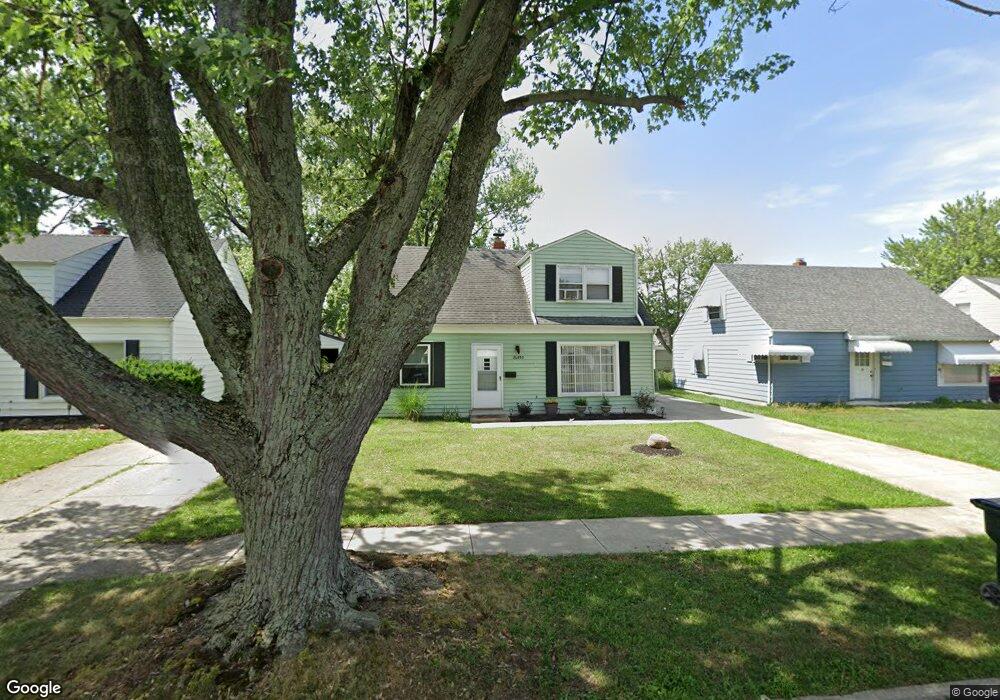
26850 Farringdon Ave Euclid, OH 44132
Estimated Value: $135,492 - $148,000
3
Beds
2
Baths
1,241
Sq Ft
$113/Sq Ft
Est. Value
About This Home
This home is located at 26850 Farringdon Ave, Euclid, OH 44132 and is currently estimated at $140,623, approximately $113 per square foot. 26850 Farringdon Ave is a home located in Cuyahoga County with nearby schools including Shoreview Elementary School, Euclid High School, and Ss Robert & William Catholic School.
Ownership History
Date
Name
Owned For
Owner Type
Purchase Details
Closed on
Mar 20, 2019
Sold by
Smartlandrs17 Llc
Bought by
Hyshphean Holdings Llc
Current Estimated Value
Purchase Details
Closed on
Jul 26, 2018
Sold by
Smarthland Rs 18 Llc
Bought by
Smarthlandrs17 Llc
Purchase Details
Closed on
Jul 12, 2018
Sold by
Jackson Elaine L and Keybank National Association
Bought by
Smartland Rs18 Llc
Purchase Details
Closed on
Dec 22, 2009
Sold by
Estate Of Robert L Fleming Sr
Bought by
Jackson Elaine L
Purchase Details
Closed on
Jun 16, 1989
Sold by
Craine Daniel L
Bought by
Fleming Robert L
Purchase Details
Closed on
Dec 8, 1983
Bought by
Craine Daniel L
Purchase Details
Closed on
Sep 15, 1983
Sold by
Johnson Edward A
Bought by
The Ohio Savings Assoc
Purchase Details
Closed on
Feb 7, 1978
Sold by
Burhenne D A and P A
Bought by
Johnson Edward A
Purchase Details
Closed on
Jan 1, 1975
Bought by
Burhenne D A and P A
Create a Home Valuation Report for This Property
The Home Valuation Report is an in-depth analysis detailing your home's value as well as a comparison with similar homes in the area
Home Values in the Area
Average Home Value in this Area
Purchase History
| Date | Buyer | Sale Price | Title Company |
|---|---|---|---|
| Hyshphean Holdings Llc | $94,000 | Nova Title Agency Inc | |
| Smarthlandrs17 Llc | -- | Nova Title Agency Inc | |
| Smartland Rs18 Llc | $42,000 | None Available | |
| Jackson Elaine L | -- | Attorney | |
| Fleming Robert L | $66,200 | -- | |
| Craine Daniel L | $42,000 | -- | |
| The Ohio Savings Assoc | $30,000 | -- | |
| Johnson Edward A | $28,500 | -- | |
| Burhenne D A | -- | -- |
Source: Public Records
Tax History
| Year | Tax Paid | Tax Assessment Tax Assessment Total Assessment is a certain percentage of the fair market value that is determined by local assessors to be the total taxable value of land and additions on the property. | Land | Improvement |
|---|---|---|---|---|
| 2024 | $2,752 | $38,955 | $8,435 | $30,520 |
| 2023 | $2,523 | $28,420 | $6,370 | $22,050 |
| 2022 | $2,467 | $28,420 | $6,370 | $22,050 |
| 2021 | $2,750 | $28,420 | $6,370 | $22,050 |
| 2020 | $2,674 | $25,130 | $5,500 | $19,640 |
| 2019 | $2,458 | $71,800 | $15,700 | $56,100 |
| 2018 | $2,694 | $25,130 | $5,500 | $19,640 |
| 2017 | $2,592 | $22,400 | $4,550 | $17,850 |
| 2016 | $2,598 | $22,400 | $4,550 | $17,850 |
| 2015 | $2,370 | $22,400 | $4,550 | $17,850 |
| 2014 | $2,370 | $22,400 | $4,550 | $17,850 |
Source: Public Records
Map
Nearby Homes
- 610 E 266th St
- 26831 Shoreview Ave
- 26931 Shoreview Ave
- 27190 Zeman Ave
- 26530 Shoreview Ave
- 26430 Drakefield Ave
- 643 E 261st St
- 27125 Mallard Ave
- 670 Hemlock Dr
- 579 E 260th St
- 571 E 260th St
- 730 Hemlock Dr
- 26171 Shoreview Ave
- 597 Hemlock Dr
- 591 Hemlock Dr
- 815 E 272nd St
- 25751 Briardale Ave
- 25731 Zeman Ave
- 25671 Farringdon Ave
- 25700 Briardale Ave
- 26830 Farringdon Ave
- 26870 Farringdon Ave
- 26800 Farringdon Ave
- 26890 Farringdon Ave
- 26851 Shirley Ave
- 26871 Shirley Ave
- 26831 Shirley Ave
- 26900 Farringdon Ave
- 26891 Shirley Ave
- 26801 Shirley Ave
- 26851 Farringdon Ave
- 26871 Farringdon Ave
- 26831 Farringdon Ave
- 675 E 266th St
- 671 E 266th St
- 26901 Shirley Ave
- 26891 Farringdon Ave
- 26801 Farringdon Ave
- 681 E 266th St
- 26930 Farringdon Ave
Your Personal Tour Guide
Ask me questions while you tour the home.