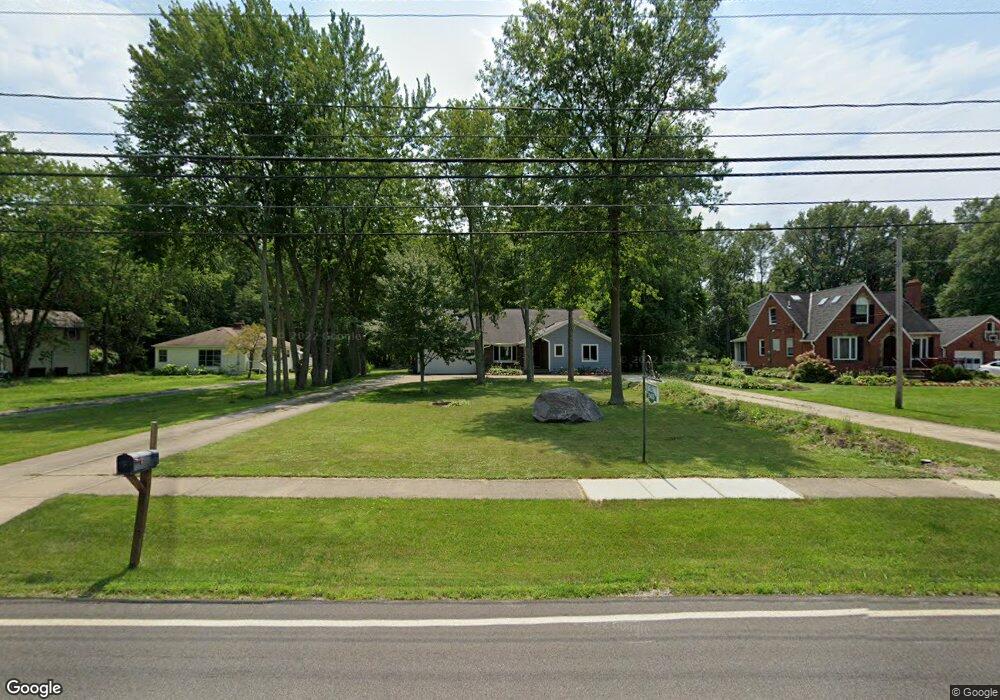
26855 Cook Rd Olmsted Falls, OH 44138
Estimated Value: $398,000 - $596,000
4
Beds
3
Baths
2,993
Sq Ft
$169/Sq Ft
Est. Value
About This Home
This home is located at 26855 Cook Rd, Olmsted Falls, OH 44138 and is currently estimated at $504,330, approximately $168 per square foot. 26855 Cook Rd is a home located in Cuyahoga County with nearby schools including Falls-Lenox Primary Elementary School, Olmsted Falls Intermediate Building, and Olmsted Falls Middle School.
Ownership History
Date
Name
Owned For
Owner Type
Purchase Details
Closed on
Dec 31, 2003
Sold by
Engelmann Arthur C
Bought by
Engelmann William C
Current Estimated Value
Home Financials for this Owner
Home Financials are based on the most recent Mortgage that was taken out on this home.
Original Mortgage
$63,000
Outstanding Balance
$29,483
Interest Rate
5.91%
Mortgage Type
Seller Take Back
Estimated Equity
$474,847
Purchase Details
Closed on
Jan 24, 2001
Sold by
Engelmann Carl A
Bought by
Engelmann Arthur C and Engelmann William E
Purchase Details
Closed on
Aug 12, 1985
Sold by
Engelmann Justine E
Bought by
Engelmann Justine E and Engelmann Carl A
Purchase Details
Closed on
Jun 24, 1976
Sold by
Englemann Carl A
Bought by
Engelmann Justine E
Purchase Details
Closed on
May 24, 1976
Sold by
Murphy Leona G
Bought by
Englemann Carl A
Purchase Details
Closed on
Jan 1, 1975
Bought by
Murphy Leona G
Create a Home Valuation Report for This Property
The Home Valuation Report is an in-depth analysis detailing your home's value as well as a comparison with similar homes in the area
Home Values in the Area
Average Home Value in this Area
Purchase History
| Date | Buyer | Sale Price | Title Company |
|---|---|---|---|
| Engelmann William C | $63,000 | Guardian Title & Guaranty | |
| Engelmann Arthur C | $140,000 | Ctic | |
| Engelmann Justine E | -- | -- | |
| Engelmann Justine E | -- | -- | |
| Englemann Carl A | $6,000 | -- | |
| Murphy Leona G | -- | -- |
Source: Public Records
Mortgage History
| Date | Status | Borrower | Loan Amount |
|---|---|---|---|
| Open | Engelmann William C | $63,000 |
Source: Public Records
Tax History Compared to Growth
Tax History
| Year | Tax Paid | Tax Assessment Tax Assessment Total Assessment is a certain percentage of the fair market value that is determined by local assessors to be the total taxable value of land and additions on the property. | Land | Improvement |
|---|---|---|---|---|
| 2024 | $11,908 | $177,695 | $31,990 | $145,705 |
| 2023 | $9,203 | $110,180 | $16,450 | $93,730 |
| 2022 | $9,141 | $110,180 | $16,450 | $93,730 |
| 2021 | $8,492 | $110,180 | $16,450 | $93,730 |
| 2020 | $8,383 | $96,640 | $14,420 | $82,220 |
| 2019 | $7,443 | $276,100 | $41,200 | $234,900 |
| 2018 | $7,433 | $96,640 | $14,420 | $82,220 |
| 2017 | $7,553 | $90,790 | $12,460 | $78,330 |
| 2016 | $7,518 | $90,790 | $12,460 | $78,330 |
| 2015 | $7,157 | $90,790 | $12,460 | $78,330 |
| 2014 | $7,157 | $84,070 | $11,550 | $72,520 |
Source: Public Records
Map
Nearby Homes
- 52 Periwinkle Dr
- 42 Periwinkle Dr
- 3 Fiddle Sticks
- 11 Concert Ct
- 3 Concert Ln
- 7224 Pine Woods Way
- 20 Van Ess Dr
- 16 Van Ess Dr
- 27 Sycamore Dr
- 7296 Chestnut Ct
- 11 Brookins Dr
- 55 Patio Ln
- 5 Hawthorn Dr
- 7087 Mackenzie Rd
- 25725 Cook Rd
- 29 Carl Ln
- 3 Dogwood Ln
- VANDERBURGH Plan at Olmsted - Sanctuary of
- LYNDHURST Plan at Olmsted - Sanctuary of
- BELLEVILLE Plan at Olmsted - Sanctuary of