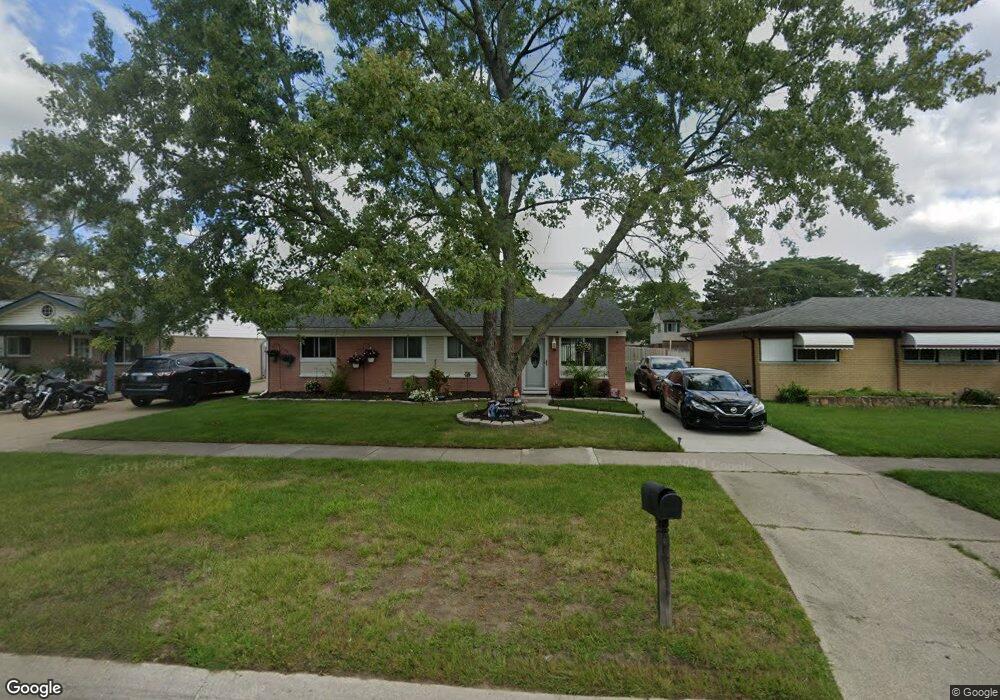
26858 Leroy St Unit Bldg-Unit Taylor, MI 48180
Estimated Value: $151,830 - $170,000
3
Beds
1
Bath
1,034
Sq Ft
$155/Sq Ft
Est. Value
About This Home
This home is located at 26858 Leroy St Unit Bldg-Unit, Taylor, MI 48180 and is currently estimated at $160,208, approximately $154 per square foot. 26858 Leroy St Unit Bldg-Unit is a home located in Wayne County with nearby schools including Myers Elementary School, Hoover Middle School, and Taylor High School.
Ownership History
Date
Name
Owned For
Owner Type
Purchase Details
Closed on
Jan 28, 2021
Sold by
S & M Home Associates Llc
Bought by
Johnson Michelle
Current Estimated Value
Purchase Details
Closed on
Jun 17, 2020
Sold by
Jrm Financial Llc
Bought by
S & M Home Associates Llc
Purchase Details
Closed on
Nov 19, 2019
Sold by
Anchor Assets V Llc
Bought by
Jrm Financial Llc
Purchase Details
Closed on
Mar 14, 2019
Sold by
Glada Asset Management Llc
Bought by
Anchor Assets V Llc
Purchase Details
Closed on
Jan 3, 2018
Sold by
Michwest Whs Llc
Bought by
Glada Asset Mangaemtn Llc
Purchase Details
Closed on
Dec 26, 2017
Sold by
Us Bank N A
Bought by
Midwest Whs Llc
Purchase Details
Closed on
Jul 28, 2017
Sold by
Golden Ronald James and Golden Cheryl Anne
Bought by
Us Bank Na
Purchase Details
Closed on
Sep 30, 2015
Sold by
Golden Ronald and Golden Cherry
Bought by
Golden Ronald
Create a Home Valuation Report for This Property
The Home Valuation Report is an in-depth analysis detailing your home's value as well as a comparison with similar homes in the area
Home Values in the Area
Average Home Value in this Area
Purchase History
| Date | Buyer | Sale Price | Title Company |
|---|---|---|---|
| Johnson Michelle | $115,000 | Title One Inc | |
| S & M Home Associates Llc | $37,000 | None Available | |
| Jrm Financial Llc | -- | None Available | |
| Anchor Assets V Llc | $60,000 | None Available | |
| Glada Asset Mangaemtn Llc | $75,000 | Regions Title Agency Llc | |
| Midwest Whs Llc | $32,500 | None Available | |
| Us Bank Na | $33,000 | None Available | |
| Golden Ronald | -- | None Available |
Source: Public Records
Tax History Compared to Growth
Tax History
| Year | Tax Paid | Tax Assessment Tax Assessment Total Assessment is a certain percentage of the fair market value that is determined by local assessors to be the total taxable value of land and additions on the property. | Land | Improvement |
|---|---|---|---|---|
| 2025 | $1,913 | $62,300 | $0 | $0 |
| 2024 | $1,913 | $56,200 | $0 | $0 |
| 2023 | $2,375 | $47,300 | $0 | $0 |
| 2022 | $1,826 | $40,000 | $0 | $0 |
| 2021 | $1,977 | $36,600 | $0 | $0 |
| 2020 | $2,806 | $32,800 | $0 | $0 |
| 2019 | $374,009 | $28,900 | $0 | $0 |
| 2018 | $1,109 | $25,900 | $0 | $0 |
| 2017 | $852 | $24,100 | $0 | $0 |
| 2016 | $1,335 | $23,500 | $0 | $0 |
| 2015 | $2,040 | $20,400 | $0 | $0 |
| 2013 | $2,450 | $25,000 | $0 | $0 |
| 2012 | $985 | $24,800 | $7,700 | $17,100 |
Source: Public Records
Map
Nearby Homes
- 15910 Hampden St
- 16513 Terrace Village Dr Unit 100
- 16401 Terrace Village Dr
- 15626 Wellington St
- 15532 Wellington St
- 15710 Inkster Rd
- 15143 Siebert St
- 26731 Pennsylvania Rd
- 26531 Eureka Rd
- 15684 Mcguire St
- 15810 Beech Daly Rd Unit 366
- 15810 Beech Daly Rd Unit 369
- 26291 Pennsylvania Rd
- 16103 Meadow Dr
- 15686 Meadow St
- 26263 Oakley Ct Unit 52
- 15570 Orchard St
- 15354 Oldham St
- 16031 Beech Daly Rd Unit 174
- 16031 Beech Daly Rd Unit 4
- 26858 Leroy St
- 26870 Leroy St
- 26844 Leroy St
- 26882 Leroy St
- 26830 Leroy St
- 26894 Leroy St Unit Bldg-Unit
- 26894 Leroy St
- 26863 Leroy St
- 26851 Leroy St
- 26812 Leroy St
- 26875 Leroy St
- 26837 Leroy St
- 26906 Leroy St
- 26887 Leroy St
- 26899 Leroy St
- 26809 California St
- 26918 Leroy St
- 26902 California St
- 26926 California St
- 26884 California St