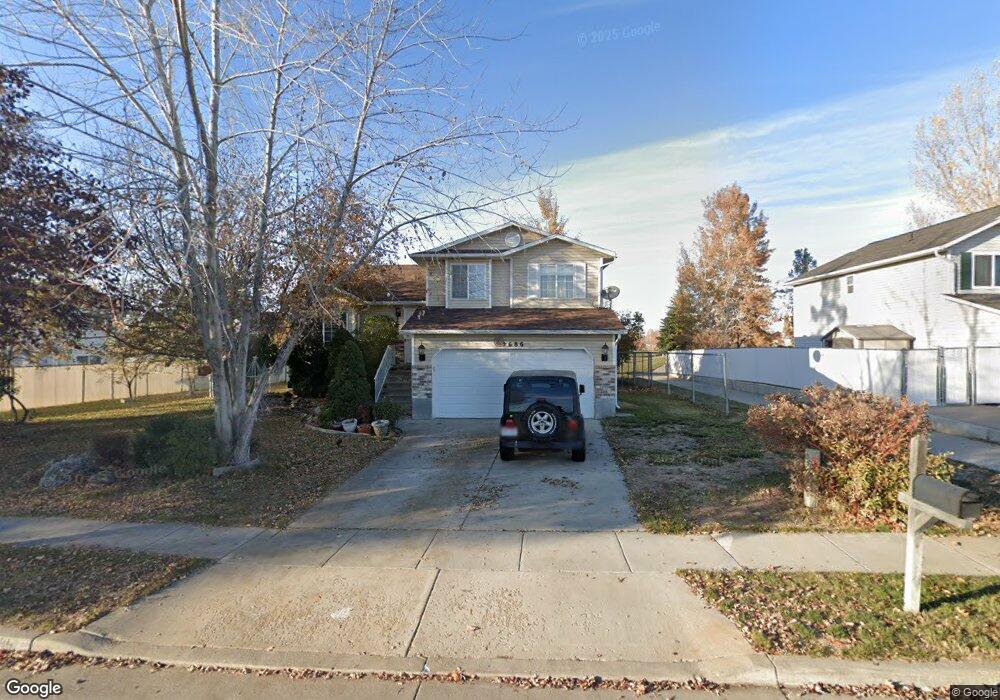
2686 W 1275 N Layton, UT 84041
Estimated Value: $468,640 - $511,000
5
Beds
2
Baths
1,845
Sq Ft
$265/Sq Ft
Est. Value
About This Home
This home is located at 2686 W 1275 N, Layton, UT 84041 and is currently estimated at $488,410, approximately $264 per square foot. 2686 W 1275 N is a home located in Davis County with nearby schools including Ellison Park School, Shoreline Junior High School, and Layton High School.
Ownership History
Date
Name
Owned For
Owner Type
Purchase Details
Closed on
Dec 3, 2004
Sold by
Lira Jose and Lira Margoth
Bought by
Lira Jose and Lira Margoth
Current Estimated Value
Purchase Details
Closed on
Nov 5, 2004
Sold by
Simkins Timothy J and Simkins Christey L
Bought by
Lira Jose and Lira Margeth
Purchase Details
Closed on
Feb 12, 1999
Sold by
Simkins Timothy J
Bought by
Simkins Timothy J and Simkins Christey L
Home Financials for this Owner
Home Financials are based on the most recent Mortgage that was taken out on this home.
Original Mortgage
$132,024
Interest Rate
6.79%
Mortgage Type
FHA
Purchase Details
Closed on
Feb 8, 1999
Sold by
Woodside Homes Corp
Bought by
Simkins Timothy J
Home Financials for this Owner
Home Financials are based on the most recent Mortgage that was taken out on this home.
Original Mortgage
$132,024
Interest Rate
6.79%
Mortgage Type
FHA
Create a Home Valuation Report for This Property
The Home Valuation Report is an in-depth analysis detailing your home's value as well as a comparison with similar homes in the area
Home Values in the Area
Average Home Value in this Area
Purchase History
| Date | Buyer | Sale Price | Title Company |
|---|---|---|---|
| Lira Jose | -- | Security Title | |
| Lira Jose | -- | Backman Stewart Title Svcs | |
| Simkins Timothy J | -- | First American Title Co | |
| Simkins Timothy J | -- | First American Title Co |
Source: Public Records
Mortgage History
| Date | Status | Borrower | Loan Amount |
|---|---|---|---|
| Previous Owner | Simkins Timothy J | $132,024 |
Source: Public Records
Tax History Compared to Growth
Tax History
| Year | Tax Paid | Tax Assessment Tax Assessment Total Assessment is a certain percentage of the fair market value that is determined by local assessors to be the total taxable value of land and additions on the property. | Land | Improvement |
|---|---|---|---|---|
| 2025 | $2,332 | $244,750 | $111,591 | $133,159 |
| 2024 | $2,252 | $238,150 | $123,298 | $114,852 |
| 2023 | $2,157 | $402,000 | $122,288 | $279,712 |
| 2022 | $2,342 | $237,050 | $76,285 | $160,765 |
| 2021 | $2,060 | $311,000 | $114,451 | $196,549 |
| 2020 | $1,858 | $269,000 | $96,317 | $172,683 |
| 2019 | $1,798 | $255,000 | $98,892 | $156,108 |
| 2018 | $1,721 | $245,000 | $86,728 | $158,272 |
| 2016 | $1,497 | $109,945 | $34,038 | $75,907 |
| 2015 | $1,506 | $105,050 | $34,038 | $71,012 |
| 2014 | $1,469 | $104,737 | $34,038 | $70,699 |
| 2013 | -- | $104,765 | $28,952 | $75,813 |
Source: Public Records
Map
Nearby Homes