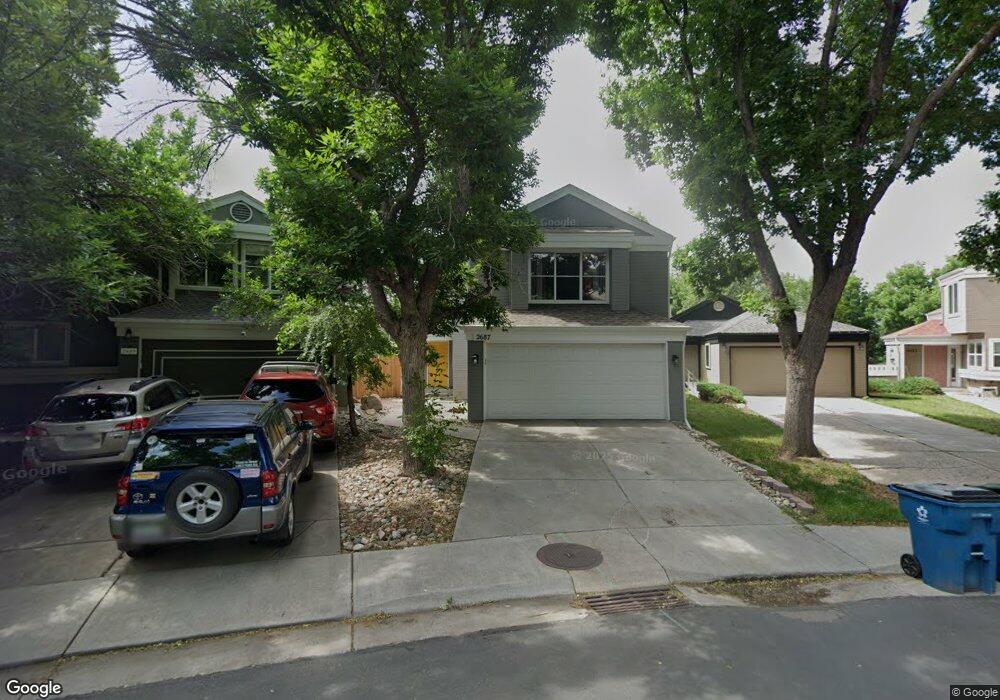
2687 S Deframe Cir Lakewood, CO 80228
Green Mountain NeighborhoodEstimated Value: $551,000 - $614,000
4
Beds
3
Baths
2,011
Sq Ft
$293/Sq Ft
Est. Value
About This Home
This home is located at 2687 S Deframe Cir, Lakewood, CO 80228 and is currently estimated at $589,050, approximately $292 per square foot. 2687 S Deframe Cir is a home located in Jefferson County with nearby schools including Rooney Ranch Elementary School, Dunstan Middle School, and Green Mountain High School.
Ownership History
Date
Name
Owned For
Owner Type
Purchase Details
Closed on
Jan 20, 2024
Sold by
Worley Nicholas A and Cazaux Micah
Bought by
Merestone Properties Llc
Current Estimated Value
Purchase Details
Closed on
Aug 26, 2021
Sold by
Birkholz Nadine A and Estate Of Donald F Birkholz Jr
Bought by
Worley Nicholas A and Cazaux Micah
Home Financials for this Owner
Home Financials are based on the most recent Mortgage that was taken out on this home.
Original Mortgage
$363,750
Interest Rate
2.8%
Mortgage Type
New Conventional
Purchase Details
Closed on
Jun 3, 2011
Sold by
Birkholz Donald F and Burkholz Dolores Ann
Bought by
Birkholz Dolores Ann and Birkholz Donald F
Purchase Details
Closed on
Nov 16, 2000
Sold by
Jr Birkholz Dolores Ann Birkholz Donal
Bought by
Birkholz Donald F and Birkholz Dolores A
Home Financials for this Owner
Home Financials are based on the most recent Mortgage that was taken out on this home.
Original Mortgage
$152,000
Interest Rate
7.82%
Create a Home Valuation Report for This Property
The Home Valuation Report is an in-depth analysis detailing your home's value as well as a comparison with similar homes in the area
Home Values in the Area
Average Home Value in this Area
Purchase History
| Date | Buyer | Sale Price | Title Company |
|---|---|---|---|
| Merestone Properties Llc | -- | None Listed On Document | |
| Worley Nicholas A | $485,000 | None Available | |
| Birkholz Dolores Ann | -- | None Available | |
| Birkholz Donald F | -- | -- |
Source: Public Records
Mortgage History
| Date | Status | Borrower | Loan Amount |
|---|---|---|---|
| Previous Owner | Worley Nicholas A | $363,750 | |
| Previous Owner | Birkholz Donald F | $152,000 |
Source: Public Records
Tax History Compared to Growth
Tax History
| Year | Tax Paid | Tax Assessment Tax Assessment Total Assessment is a certain percentage of the fair market value that is determined by local assessors to be the total taxable value of land and additions on the property. | Land | Improvement |
|---|---|---|---|---|
| 2024 | $2,790 | $30,933 | $11,484 | $19,449 |
| 2023 | $2,790 | $30,933 | $11,484 | $19,449 |
| 2022 | $2,641 | $28,623 | $10,185 | $18,438 |
| 2021 | $2,678 | $29,447 | $10,478 | $18,969 |
| 2020 | $1,592 | $24,731 | $7,161 | $17,570 |
| 2019 | $1,571 | $24,731 | $7,161 | $17,570 |
| 2018 | $1,567 | $24,154 | $8,250 | $15,904 |
| 2017 | $1,377 | $24,154 | $8,250 | $15,904 |
| 2016 | $1,392 | $23,949 | $8,690 | $15,259 |
| 2015 | $983 | $23,949 | $8,690 | $15,259 |
| 2014 | $983 | $18,310 | $5,829 | $12,481 |
Source: Public Records
Map
Nearby Homes
- 2675 S Deframe Cir
- 13815 W Amherst Way
- 2663 S Deframe Cir
- 2540 S Deframe St
- 14420 W Yale Place
- 2703 S Cole Ct
- 2911 S Coors Dr
- 2914 S Deframe Way
- 2336 S Eldridge Ct
- 13804 W Iliff Ave
- 2332 S Fig St
- 2811 S Fig St
- 2175 S Deframe St
- 13126 W Warren Cir
- 14630 W Amherst Place
- 13934 W Warren Dr
- 13126 W Jewell Cir
- 2037 S Welch Cir
- 1882 S Zinnia Way
- 15116 W Harvard Cir
- 2685 S Deframe Cir
- 2689 S Deframe Cir
- 2683 S Deframe Cir
- 2691 S Deframe Cir
- 2681 S Deframe Cir
- 2693 S Deframe Cir
- 2688 S Deframe Cir
- 2679 S Deframe Cir
- 2690 S Deframe Cir
- 2695 S Deframe Cir
- 2677 S Deframe Cir
- 13813 W Amherst Way
- 2694 S Deframe Cir
- 2674 S Deframe Cir
- 13811 W Amherst Way
- 2697 S Deframe Cir
- 13809 W Amherst Way
- 2696 S Deframe Cir
- 2672 S Deframe Cir
- 13807 W Amherst Way