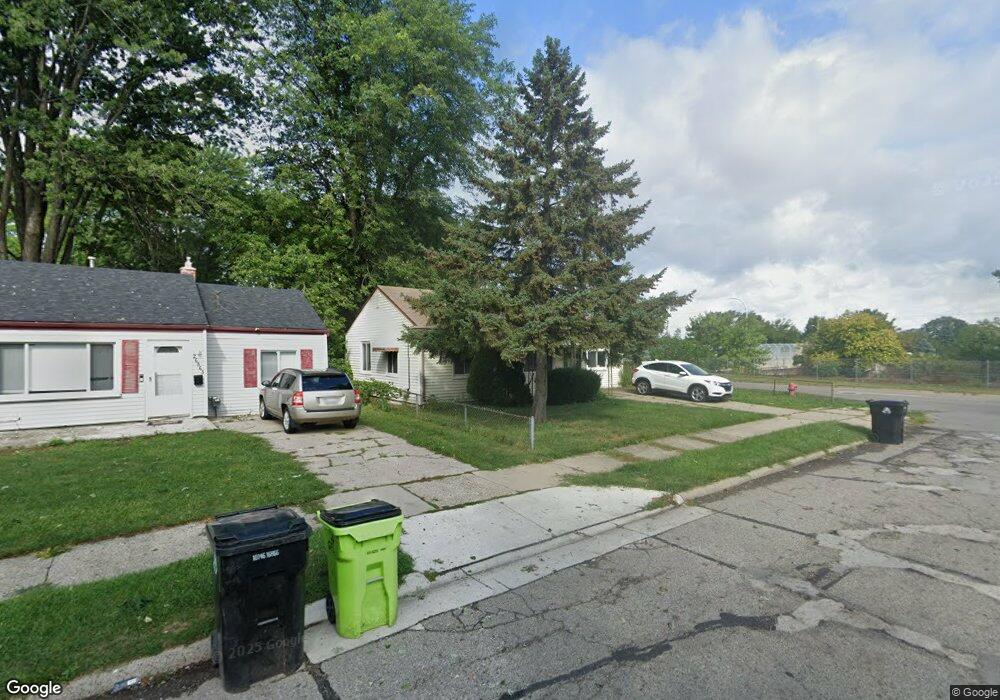
26873 Nagel St Roseville, MI 48066
Estimated Value: $83,000 - $124,388
2
Beds
1
Bath
1,204
Sq Ft
$91/Sq Ft
Est. Value
About This Home
This home is located at 26873 Nagel St, Roseville, MI 48066 and is currently estimated at $109,097, approximately $90 per square foot. 26873 Nagel St is a home located in Macomb County with nearby schools including Kaiser Elementary School, Dort Elementary School, and Joseph G. Steenland Elementary School.
Ownership History
Date
Name
Owned For
Owner Type
Purchase Details
Closed on
Jun 29, 2023
Sold by
Sokol Amy
Bought by
Saliga Jeffrey
Current Estimated Value
Home Financials for this Owner
Home Financials are based on the most recent Mortgage that was taken out on this home.
Original Mortgage
$94,050
Outstanding Balance
$91,584
Interest Rate
6.71%
Estimated Equity
$17,513
Purchase Details
Closed on
May 5, 2023
Sold by
Michael S Guitar S and Michael Renee A
Bought by
Mullins Denise
Home Financials for this Owner
Home Financials are based on the most recent Mortgage that was taken out on this home.
Original Mortgage
$94,050
Outstanding Balance
$91,584
Interest Rate
6.71%
Estimated Equity
$17,513
Purchase Details
Closed on
Jun 29, 2016
Sold by
Guitar Michael S and Guitar Renee
Bought by
Guitar Michael S and Guitar Renee
Purchase Details
Closed on
Mar 27, 2002
Sold by
Rach Carl R
Bought by
Guitar Michael S
Create a Home Valuation Report for This Property
The Home Valuation Report is an in-depth analysis detailing your home's value as well as a comparison with similar homes in the area
Home Values in the Area
Average Home Value in this Area
Purchase History
| Date | Buyer | Sale Price | Title Company |
|---|---|---|---|
| Saliga Jeffrey | $95,000 | None Listed On Document | |
| Saliga Jeffrey | $95,000 | None Listed On Document | |
| Mullins Denise | $40,000 | Michigan Investment Title | |
| Guitar Michael S | -- | Attorney | |
| Guitar Michael S | $57,000 | -- |
Source: Public Records
Mortgage History
| Date | Status | Borrower | Loan Amount |
|---|---|---|---|
| Open | Saliga Jeffrey | $94,050 | |
| Closed | Saliga Jeffrey | $94,050 | |
| Closed | Guitar Michael S | -- |
Source: Public Records
Tax History Compared to Growth
Tax History
| Year | Tax Paid | Tax Assessment Tax Assessment Total Assessment is a certain percentage of the fair market value that is determined by local assessors to be the total taxable value of land and additions on the property. | Land | Improvement |
|---|---|---|---|---|
| 2025 | $3,711 | $32,322 | $0 | $0 |
| 2024 | $1,969 | $62,700 | $0 | $0 |
| 2023 | $811 | $54,400 | $0 | $0 |
| 2022 | $1,600 | $47,000 | $0 | $0 |
| 2021 | $1,382 | $41,700 | $0 | $0 |
| 2020 | $789 | $37,900 | $0 | $0 |
| 2019 | $1,280 | $30,900 | $0 | $0 |
| 2018 | $1,190 | $0 | $0 | $0 |
| 2017 | $1,110 | $24,949 | $7,588 | $17,361 |
| 2016 | $1,280 | $24,949 | $0 | $0 |
| 2015 | $752 | $21,630 | $0 | $0 |
| 2013 | -- | $22,487 | $0 | $0 |
| 2011 | -- | $23,953 | $0 | $0 |
Source: Public Records
Map
Nearby Homes
- 26750 Belanger St
- 26700 Belanger St
- 27100 Woodmont St
- 26621 Kathy St
- 27130 Woodmont St
- 27241 Woodmont St
- 26584 Kathy St
- 15251 Wildwood St
- 15238 Troy St
- 26620 Academy St
- 26730 Ridgemont St
- 15329 Petrie St
- 26140 Nagel St
- 26354 Dale Ct
- 26342 Grandmont St
- 26204 Belanger St
- 15214 Petrie St
- 26211 Clancy St
- 27155 Blum St
- 26371 Compson St
- 26863 Nagel St
- 26853 Nagel St
- 26760 Belanger St
- 26843 Nagel St
- 26740 Belanger St
- 26870 Nagel St
- 26860 Nagel St
- 26833 Nagel St
- 26730 Belanger St Unit Bldg-Unit
- 26730 Belanger St
- 26850 Nagel St
- 26840 Nagel St
- 26823 Nagel St
- 26720 Belanger St
- 26830 Nagel St
- 26761 Belanger St
- 26751 Belanger St
- 22759 Belanger St
- 26813 Nagel St
- 26741 Belanger St