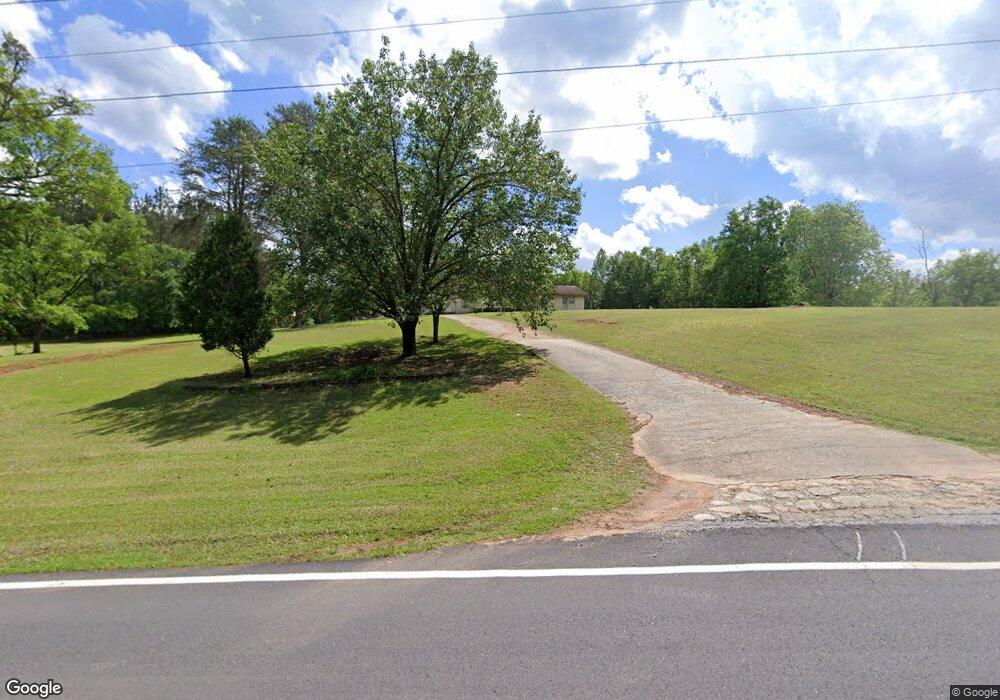
2689 Deep Creek Rd Bowman, GA 30624
Estimated Value: $223,000 - $355,000
--
Bed
3
Baths
2,574
Sq Ft
$107/Sq Ft
Est. Value
About This Home
This home is located at 2689 Deep Creek Rd, Bowman, GA 30624 and is currently estimated at $275,089, approximately $106 per square foot. 2689 Deep Creek Rd is a home located in Elbert County with nearby schools including Elbert County Elementary School, Elbert County Primary School, and Elbert County Middle School.
Ownership History
Date
Name
Owned For
Owner Type
Purchase Details
Closed on
Aug 11, 2020
Sold by
Daugherty Pamela G
Bought by
Moon Andy T and Moon Gerianna E
Current Estimated Value
Home Financials for this Owner
Home Financials are based on the most recent Mortgage that was taken out on this home.
Original Mortgage
$100,000
Outstanding Balance
$88,542
Interest Rate
2.9%
Mortgage Type
New Conventional
Estimated Equity
$186,547
Purchase Details
Closed on
Jun 20, 2020
Sold by
Dahlroos Debra G
Bought by
Dahlroos Debra G and Harris Anthony Joe
Home Financials for this Owner
Home Financials are based on the most recent Mortgage that was taken out on this home.
Original Mortgage
$100,000
Outstanding Balance
$88,542
Interest Rate
2.9%
Mortgage Type
New Conventional
Estimated Equity
$186,547
Purchase Details
Closed on
Oct 29, 2019
Sold by
Daugherty Pamela G
Bought by
Goss Robert D and Goss Patsy O
Purchase Details
Closed on
Apr 1, 1976
Purchase Details
Closed on
Feb 1, 1975
Purchase Details
Closed on
Apr 1, 1946
Create a Home Valuation Report for This Property
The Home Valuation Report is an in-depth analysis detailing your home's value as well as a comparison with similar homes in the area
Home Values in the Area
Average Home Value in this Area
Purchase History
| Date | Buyer | Sale Price | Title Company |
|---|---|---|---|
| Moon Andy T | $99,000 | -- | |
| Dahlroos Debra G | -- | -- | |
| Dahlroos Debra G | -- | -- | |
| Dahlroos Debra G | -- | -- | |
| Goss Robert D | -- | -- | |
| Daugherty David L | -- | -- | |
| Daugherty David L | -- | -- | |
| -- | -- | -- | |
| -- | -- | -- | |
| -- | $800 | -- |
Source: Public Records
Mortgage History
| Date | Status | Borrower | Loan Amount |
|---|---|---|---|
| Open | Moon Andy T | $100,000 |
Source: Public Records
Tax History Compared to Growth
Tax History
| Year | Tax Paid | Tax Assessment Tax Assessment Total Assessment is a certain percentage of the fair market value that is determined by local assessors to be the total taxable value of land and additions on the property. | Land | Improvement |
|---|---|---|---|---|
| 2024 | $2,291 | $97,529 | $7,904 | $89,625 |
| 2023 | $2,291 | $97,529 | $7,904 | $89,625 |
| 2022 | $1,421 | $61,258 | $4,706 | $56,552 |
| 2021 | $903 | $61,258 | $4,706 | $56,552 |
| 2020 | $1,008 | $47,094 | $3,764 | $43,330 |
| 2019 | $1,165 | $51,264 | $6,868 | $44,396 |
| 2018 | $1,201 | $51,264 | $6,868 | $44,396 |
| 2017 | $1,055 | $43,574 | $6,868 | $36,706 |
| 2016 | $985 | $43,574 | $6,868 | $36,706 |
| 2015 | -- | $43,574 | $6,868 | $36,706 |
| 2014 | -- | $43,726 | $6,868 | $36,858 |
| 2013 | -- | $43,726 | $6,868 | $36,858 |
Source: Public Records
Map
Nearby Homes
- 1541 Cordell Rd
- 1574 Cordell Rd
- 2448 Allen White Rd
- 2784 Stanley Maxwell Rd
- 0 Fork Creek Rd Unit 10616779
- 0 Fork Creek Rd Unit 7659678
- 0 Sand Hill Rd Unit 10595328
- 2198 Bennett Rd
- 2004 Christian Rd
- 2051 Hewell Rd NW
- 2851 Bowman Hwy
- 1257 Seymour Rd
- 1255 Seymour Rd
- 1963 Rehoboth Rd Unit EXTENSION
- 1963 Rehoboth Rd
- 2070 Hobbs Noggle Rd NW
- 227 Rehoboth Rd
- 0 Bowers St Unit LOT 1-8 10576344
- 0 Bowers St Unit LOT 1-8 CL335681
- 3334 Cherokee Rd
- 2705 Deep Creek Rd
- 2663 Deep Creek Rd
- 2727 Deep Creek Rd
- 0A Deep Creek Rd
- 0 Deep Creek Rd Unit 8681541
- 0 Deep Creek Rd Unit 8478638
- 0 Deep Creek Rd Unit 8451966
- 0 Deep Creek Rd Unit 8385473
- 0 Deep Creek Rd Unit 9061933
- 0 Deep Creek Rd Unit 8097921
- 0 Deep Creek Rd Unit 8719463
- 0 Deep Creek Rd Unit 3213806
- 0 Deep Creek Rd
- 2749 Deep Creek Rd
- 2732 Deep Creek Rd
- 2739 Deep Creek Rd
- 2751 Deep Creek Rd
- 1764 Fork Creek Rd
- 1738 Fork Creek Rd
- 2614 Deep Creek Rd Unit TRACT #3