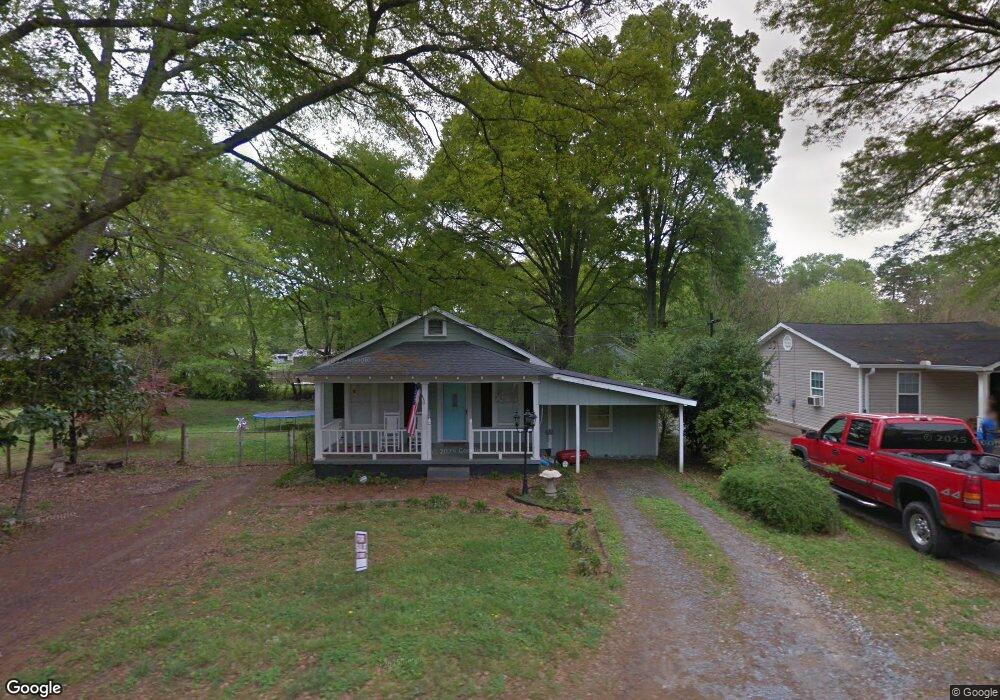
269 Adams Ave Cedartown, GA 30125
Estimated Value: $111,472 - $191,000
3
Beds
1
Bath
1,340
Sq Ft
$110/Sq Ft
Est. Value
About This Home
This home is located at 269 Adams Ave, Cedartown, GA 30125 and is currently estimated at $146,868, approximately $109 per square foot. 269 Adams Ave is a home located in Polk County with nearby schools including Cedar Christian School.
Ownership History
Date
Name
Owned For
Owner Type
Purchase Details
Closed on
Oct 12, 2020
Sold by
Maddox Sandra O
Bought by
Baines Haley
Current Estimated Value
Purchase Details
Closed on
Nov 5, 2018
Sold by
Shaw Hannah J
Bought by
Smull Sandra O
Purchase Details
Closed on
Aug 22, 2014
Sold by
Collier Shirley J
Bought by
Shaw Hannah J
Home Financials for this Owner
Home Financials are based on the most recent Mortgage that was taken out on this home.
Original Mortgage
$48,800
Interest Rate
4.2%
Mortgage Type
New Conventional
Purchase Details
Closed on
Mar 14, 2014
Sold by
Collier Shirley J
Bought by
Collier Shirley J **
Purchase Details
Closed on
Jul 15, 1975
Sold by
Stroup Terry and Stroup Larry
Bought by
Bush Shirley J
Purchase Details
Closed on
Jun 25, 1974
Sold by
Godwin H P
Bought by
Stroup Terry and Stroup Larry
Purchase Details
Closed on
Apr 19, 1965
Sold by
Odom John A
Bought by
Godwin H P
Purchase Details
Closed on
Aug 2, 1958
Bought by
Odom John A
Create a Home Valuation Report for This Property
The Home Valuation Report is an in-depth analysis detailing your home's value as well as a comparison with similar homes in the area
Home Values in the Area
Average Home Value in this Area
Purchase History
| Date | Buyer | Sale Price | Title Company |
|---|---|---|---|
| Baines Haley | -- | -- | |
| Smull Sandra O | $47,000 | -- | |
| Shaw Hannah J | $48,800 | -- | |
| Collier Shirley J ** | -- | -- | |
| Bush Shirley J | -- | -- | |
| Stroup Terry | -- | -- | |
| Godwin H P | -- | -- | |
| Odom John A | -- | -- |
Source: Public Records
Mortgage History
| Date | Status | Borrower | Loan Amount |
|---|---|---|---|
| Previous Owner | Shaw Hannah J | $48,800 |
Source: Public Records
Tax History Compared to Growth
Tax History
| Year | Tax Paid | Tax Assessment Tax Assessment Total Assessment is a certain percentage of the fair market value that is determined by local assessors to be the total taxable value of land and additions on the property. | Land | Improvement |
|---|---|---|---|---|
| 2024 | $604 | $28,916 | $2,200 | $26,716 |
| 2023 | $471 | $19,864 | $374 | $19,490 |
| 2022 | $401 | $16,912 | $374 | $16,538 |
| 2021 | $407 | $16,912 | $374 | $16,538 |
| 2020 | $407 | $16,912 | $374 | $16,538 |
| 2019 | $370 | $13,770 | $1,008 | $12,762 |
| 2018 | $309 | $13,210 | $864 | $12,346 |
| 2017 | $305 | $13,210 | $864 | $12,346 |
| 2016 | $305 | $13,210 | $864 | $12,346 |
| 2015 | $314 | $13,498 | $864 | $12,634 |
| 2014 | $236 | $10,592 | $864 | $9,728 |
Source: Public Records
Map
Nearby Homes
- 0 Mcarthur St Unit 5903847
- 0 Mcarthur St Unit 8253438
- 0 Mcarthur St Unit 7518271
- 0 Mcarthur St Unit 5592003
- 2 Elsie Ln
- 500 Collard Valley Rd
- 275 Adams Ave
- 502 Collard Valley Rd
- 254 Adams Ave
- 504 Collard Valley Rd
- 281 Adams Ave
- 281 Adams Ave
- 280 Adams Ave
- 4 Elsie Ln
- 252 Adams Ave
- 287 Adams Ave Unit 13
- 287 Adams Ave
- 244 Adams Ave
- 501 Collard Valley Rd
- 248 Adams Ave