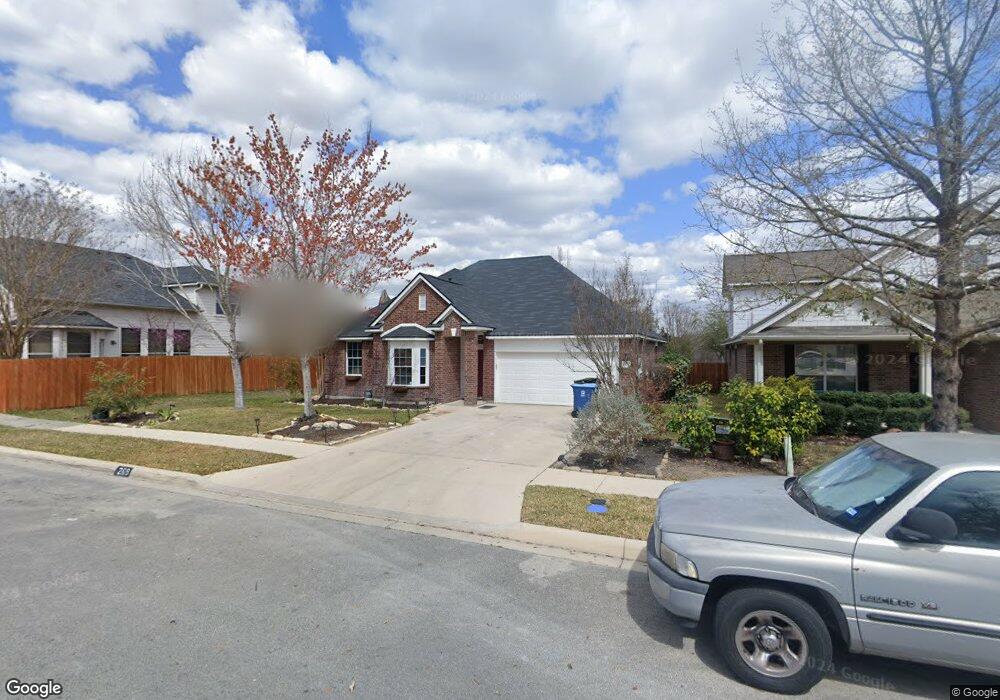
269 C J Jones Cove Cibolo, TX 78108
Estimated Value: $322,000 - $344,000
3
Beds
2
Baths
2,082
Sq Ft
$160/Sq Ft
Est. Value
About This Home
This home is located at 269 C J Jones Cove, Cibolo, TX 78108 and is currently estimated at $333,117, approximately $159 per square foot. 269 C J Jones Cove is a home located in Guadalupe County with nearby schools including Wiederstein Elementary School, Barbara Jordan Intermediate School, and Dobie J High School.
Ownership History
Date
Name
Owned For
Owner Type
Purchase Details
Closed on
Oct 6, 2017
Sold by
Bertram Nancy L
Bought by
Morris Mitchell and Morris Shanna M
Current Estimated Value
Home Financials for this Owner
Home Financials are based on the most recent Mortgage that was taken out on this home.
Original Mortgage
$161,700
Interest Rate
3.91%
Mortgage Type
New Conventional
Purchase Details
Closed on
Jun 13, 2008
Sold by
Neri Jesus M
Bought by
Morris Mitchell and Morris Shanna M
Home Financials for this Owner
Home Financials are based on the most recent Mortgage that was taken out on this home.
Original Mortgage
$178,489
Interest Rate
6.05%
Mortgage Type
Purchase Money Mortgage
Purchase Details
Closed on
Feb 25, 2005
Sold by
Mhi Partnership Ltd
Bought by
Neri Jesus M
Home Financials for this Owner
Home Financials are based on the most recent Mortgage that was taken out on this home.
Original Mortgage
$14,000
Interest Rate
5.71%
Mortgage Type
Stand Alone Second
Create a Home Valuation Report for This Property
The Home Valuation Report is an in-depth analysis detailing your home's value as well as a comparison with similar homes in the area
Home Values in the Area
Average Home Value in this Area
Purchase History
| Date | Buyer | Sale Price | Title Company |
|---|---|---|---|
| Morris Mitchell | -- | Title Source | |
| Morris Mitchell | -- | None Available | |
| Neri Jesus M | -- | Stc |
Source: Public Records
Mortgage History
| Date | Status | Borrower | Loan Amount |
|---|---|---|---|
| Previous Owner | Morris Mitchell | $161,700 | |
| Previous Owner | Morris Mitchell | $178,489 | |
| Previous Owner | Neri Jesus M | $14,000 | |
| Previous Owner | Neri Jesus M | $130,453 |
Source: Public Records
Tax History Compared to Growth
Tax History
| Year | Tax Paid | Tax Assessment Tax Assessment Total Assessment is a certain percentage of the fair market value that is determined by local assessors to be the total taxable value of land and additions on the property. | Land | Improvement |
|---|---|---|---|---|
| 2025 | $5,666 | $288,554 | $38,131 | $250,423 |
| 2024 | $5,666 | $349,302 | $39,337 | $346,705 |
| 2023 | $6,136 | $317,547 | $51,660 | $314,264 |
| 2022 | $6,212 | $288,679 | $39,815 | $316,164 |
| 2021 | $5,982 | $262,435 | $31,880 | $230,555 |
| 2020 | $5,815 | $253,334 | $32,000 | $221,334 |
| 2019 | $5,378 | $229,904 | $32,000 | $197,904 |
| 2018 | $5,461 | $235,674 | $26,000 | $209,674 |
| 2017 | $4,805 | $217,613 | $25,000 | $192,613 |
| 2016 | $4,805 | $208,693 | $22,000 | $186,693 |
| 2015 | $4,805 | $199,201 | $18,400 | $180,801 |
| 2014 | $4,084 | $175,304 | $18,400 | $156,904 |
Source: Public Records
Map
Nearby Homes
- 228 Comanche Trail
- 213 Nomad Ln
- 248 Fritz Way
- 109 Lieck Cove
- 157 Bison Ln
- 153 Bison Ln
- Jefferson Plan at Buffalo Crossing
- Groveton Plan at Buffalo Crossing
- Denison Plan at Buffalo Crossing
- Hideaway Plan at Buffalo Crossing
- Brookshire Plan at Buffalo Crossing
- Dumont Plan at Buffalo Crossing
- Parker Plan at Buffalo Crossing
- Motley Plan at Buffalo Crossing
- Hart Plan at Buffalo Crossing
- Nevada Plan at Buffalo Crossing
- Inwood Plan at Buffalo Crossing
- Logan II Plan at Buffalo Crossing
- Willis Plan at Buffalo Crossing
- 104 Dykes Ln
- 265 C J Jones Cove
- 228 Frontier Cove
- 261 C J Jones Cove
- 241 Lieck Cove
- 237 Lieck Cove
- 224 Frontier Cove
- 257 C J Jones Cove
- 229 Lieck Cove
- 225 Frontier Cove
- 253 C J Jones Cove
- 225 Lieck Cove
- 220 Frontier Cove
- 249 C J Jones Cove
- 221 Frontier Cove
- 232 Lieck Cove
- 221 Lieck Cove
- 228 Lieck Cove
- 217 Frontier Cove
- 217 Lieck Cove
- 236 Lieck Cove