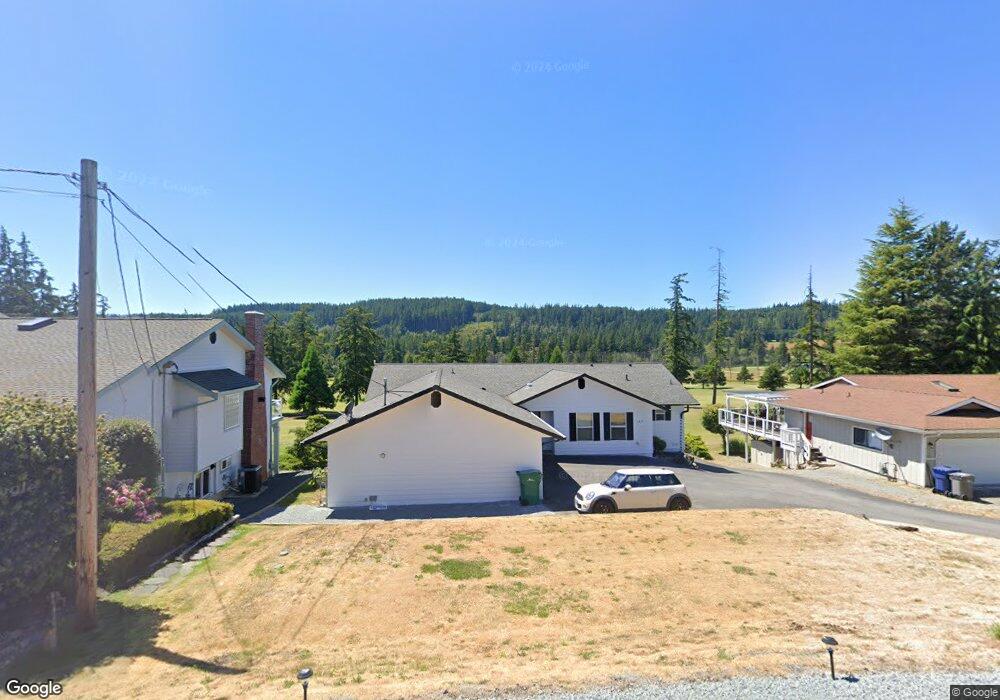
269 Camaloch Dr Camano Island, WA 98282
Estimated Value: $609,000 - $778,000
2
Beds
2
Baths
1,870
Sq Ft
$371/Sq Ft
Est. Value
About This Home
This home is located at 269 Camaloch Dr, Camano Island, WA 98282 and is currently estimated at $693,807, approximately $371 per square foot. 269 Camaloch Dr is a home located in Island County with nearby schools including Utsalady Elementary School, Port Susan Middle School, and Stanwood High School.
Ownership History
Date
Name
Owned For
Owner Type
Purchase Details
Closed on
Oct 14, 2021
Sold by
Carman Jason M and Carman Kelley C
Bought by
Carman Jason M and Carman Kelley C
Current Estimated Value
Home Financials for this Owner
Home Financials are based on the most recent Mortgage that was taken out on this home.
Original Mortgage
$314,000
Outstanding Balance
$286,339
Interest Rate
2.8%
Mortgage Type
New Conventional
Estimated Equity
$407,468
Purchase Details
Closed on
Jun 21, 2016
Sold by
Shaughnessy Thomas M and Shaughnessy Jana L
Bought by
Carman Jason M and Schwab Kelley C
Home Financials for this Owner
Home Financials are based on the most recent Mortgage that was taken out on this home.
Original Mortgage
$294,566
Interest Rate
3.62%
Mortgage Type
FHA
Purchase Details
Closed on
Jul 15, 2014
Sold by
Shaughnessy Jana
Bought by
Shaughnessy Thomas M
Create a Home Valuation Report for This Property
The Home Valuation Report is an in-depth analysis detailing your home's value as well as a comparison with similar homes in the area
Home Values in the Area
Average Home Value in this Area
Purchase History
| Date | Buyer | Sale Price | Title Company |
|---|---|---|---|
| Carman Jason M | -- | Boston National Ttl Agcy Llc | |
| Carman Jason M | $300,000 | Wfg National Title Company | |
| Shaughnessy Thomas M | -- | Accommodation |
Source: Public Records
Mortgage History
| Date | Status | Borrower | Loan Amount |
|---|---|---|---|
| Open | Carman Jason M | $314,000 | |
| Closed | Carman Jason M | $294,566 |
Source: Public Records
Tax History Compared to Growth
Tax History
| Year | Tax Paid | Tax Assessment Tax Assessment Total Assessment is a certain percentage of the fair market value that is determined by local assessors to be the total taxable value of land and additions on the property. | Land | Improvement |
|---|---|---|---|---|
| 2024 | $4,951 | $671,992 | $300,000 | $371,992 |
| 2023 | $4,951 | $636,743 | $260,000 | $376,743 |
| 2022 | $4,679 | $555,445 | $210,000 | $345,445 |
| 2021 | $4,189 | $498,433 | $200,000 | $298,433 |
| 2020 | $4,129 | $431,393 | $140,000 | $291,393 |
| 2019 | $3,597 | $419,830 | $200,000 | $219,830 |
| 2018 | $3,628 | $365,507 | $145,000 | $220,507 |
| 2017 | $3,249 | $341,859 | $120,000 | $221,859 |
| 2016 | $3,216 | $339,565 | $115,000 | $224,565 |
| 2015 | $3,168 | $323,316 | $115,000 | $208,316 |
| 2013 | -- | $313,863 | $100,000 | $213,863 |
Source: Public Records
Map
Nearby Homes
- 269 E Lochwood Dr
- 335 Heather Dr
- 0 E Shumway Rd
- 230 Heather Dr
- 302 Melrose Dr
- 355 Selkirk Dr
- 474 Stirling Dr
- 362 N Sunrise Blvd
- 105 N Sunrise Blvd
- 251 Goodrich Rd
- 245 David St
- 244 David St
- 563 Waynes Ridge Cir
- 0 Dodge Rd Unit NWM2434437
- 0 Dodge Rd Unit NWM2434435
- 441 Windsun Way
- 230 Rocky Mountain High Rd
- 289 E Driftwood Shores Rd
- 870 Cambell Dr
- 25 Anadar Place
- 263 Camaloch Dr
- 275 Camaloch Dr
- 281 Camaloch Dr
- 259 Camaloch Dr
- 251 Moorland Dr
- 278 Camaloch Dr
- 284 Camaloch Dr
- 255 Camaloch Dr
- 252 Moorland Dr
- 277 Mackenzie Dr
- 290 Camaloch Dr
- 281 Mackenzie Dr
- 293 Camaloch Dr
- 254 Camaloch Dr
- 247 Camaloch Dr
- 289 Mackenzie Dr
- 263 Mackenzie Dr
- 296 Camaloch Dr
- 293 Mackenzie Dr
- 248 Camaloch Dr