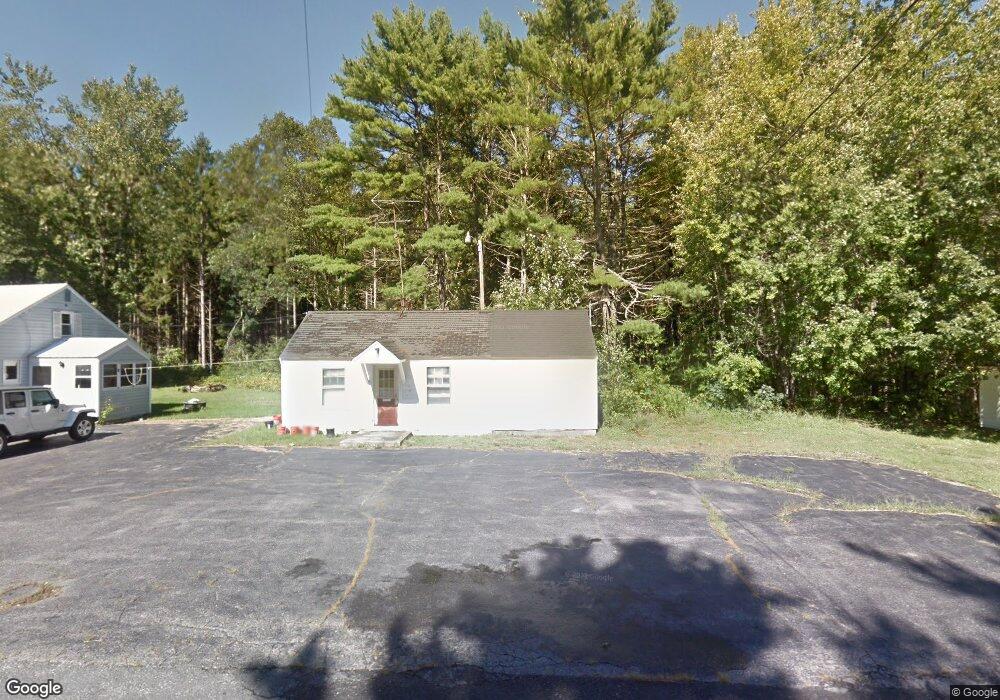
269 Country Club 3 Rd Sanford, ME 04073
South Sanford NeighborhoodEstimated Value: $292,502 - $365,000
2
Beds
1
Bath
936
Sq Ft
$363/Sq Ft
Est. Value
About This Home
This home is located at 269 Country Club 3 Rd, Sanford, ME 04073 and is currently estimated at $339,626, approximately $362 per square foot. 269 Country Club 3 Rd is a home located in York County.
Ownership History
Date
Name
Owned For
Owner Type
Purchase Details
Closed on
Jul 23, 2012
Sold by
Lpp Mortgage Ltd
Bought by
Lpp Mortgage Ltd
Current Estimated Value
Purchase Details
Closed on
Apr 22, 2011
Sold by
Morissette Deneka L and Lpp Mortgage Ltd
Bought by
Lpp Mortgage Ltd
Purchase Details
Closed on
Feb 5, 2007
Sold by
Jellerson Christa S and Gray David W
Bought by
Wayne Joshua T and Morissette Deneka
Home Financials for this Owner
Home Financials are based on the most recent Mortgage that was taken out on this home.
Original Mortgage
$131,440
Interest Rate
6.95%
Mortgage Type
FHA
Purchase Details
Closed on
Apr 7, 2005
Sold by
Mackey Jay and Crosby James
Bought by
Gray Lisa E and Jellerson Christa S
Home Financials for this Owner
Home Financials are based on the most recent Mortgage that was taken out on this home.
Original Mortgage
$145,800
Interest Rate
5.7%
Mortgage Type
FHA
Create a Home Valuation Report for This Property
The Home Valuation Report is an in-depth analysis detailing your home's value as well as a comparison with similar homes in the area
Home Values in the Area
Average Home Value in this Area
Purchase History
| Date | Buyer | Sale Price | Title Company |
|---|---|---|---|
| Lpp Mortgage Ltd | $120,000 | -- | |
| Lpp Mortgage Ltd | -- | -- | |
| Wayne Joshua T | -- | -- | |
| Gray Lisa E | -- | -- |
Source: Public Records
Mortgage History
| Date | Status | Borrower | Loan Amount |
|---|---|---|---|
| Previous Owner | Wayne Joshua T | $131,440 | |
| Previous Owner | Wayne Joshua T | $32,860 | |
| Previous Owner | Gray Lisa E | $145,800 |
Source: Public Records
Tax History Compared to Growth
Tax History
| Year | Tax Paid | Tax Assessment Tax Assessment Total Assessment is a certain percentage of the fair market value that is determined by local assessors to be the total taxable value of land and additions on the property. | Land | Improvement |
|---|---|---|---|---|
| 2025 | $3,311 | $193,600 | $47,000 | $146,600 |
| 2024 | $3,125 | $193,600 | $47,000 | $146,600 |
| 2023 | $2,908 | $192,100 | $47,000 | $145,100 |
| 2022 | $2,843 | $192,100 | $47,000 | $145,100 |
| 2021 | $2,902 | $159,600 | $47,000 | $112,600 |
| 2020 | $2,828 | $140,300 | $47,000 | $93,300 |
| 2019 | $2,743 | $132,500 | $47,000 | $85,500 |
| 2018 | $2,532 | $123,500 | $42,300 | $81,200 |
| 2017 | $2,454 | $118,300 | $42,300 | $76,000 |
| 2016 | $2,495 | $109,700 | $42,400 | $67,300 |
| 2015 | $2,561 | $116,200 | $47,100 | $69,100 |
| 2014 | $2,683 | $118,000 | $48,800 | $69,200 |
| 2013 | -- | $124,200 | $54,900 | $69,300 |
Source: Public Records
Map
Nearby Homes
- 42 Bernice Ave
- 122 Country Club 3 Rd
- 41 Sunny Ln
- 22 Lentago Ln
- Lot 4 Tbd Lentago Ln Unit Lot 4
- 45 Grace Ln
- 99 Channel Ln
- 43 Michaels Rd
- 469 High St
- 761 Quarry Rd
- 247 Sam Allen Rd
- Lot 8E Country Club Rd
- 86 Moose Bog Ln
- Lot 11 Laney Ln
- Lot 13 Laney Ln
- 56 Sam Allen Rd
- 49 Willow Dr
- Lot 55-A Ford Quint Rd
- 99 Westhaven Ln
- 85 Westhaven Ln
- 272 Country Club 3 Rd
- 283 Country Club 3 Rd
- 161 Horace Mills Rd
- 225 Country Club 3 Rd
- 530 Horace Mills Rd
- 255 Country Club 3 Rd
- 288 Country Club 3 Rd
- 537 Horace Mills Rd
- 219 Country Club 3 Rd
- 293 Country Club 3 Rd
- 526 Horace Mills Rd
- 293 Country Club Rd
- 531 Horace Mills Rd
- TBD Country Club Road #3
- 294 Country Club 3 Rd
- 523 Horace Mills Rd
- 304 Country Club 3 Rd
- 19 Lindsay Rd
- 305 Country Club 3 Rd
- 515 Horace Mills Rd