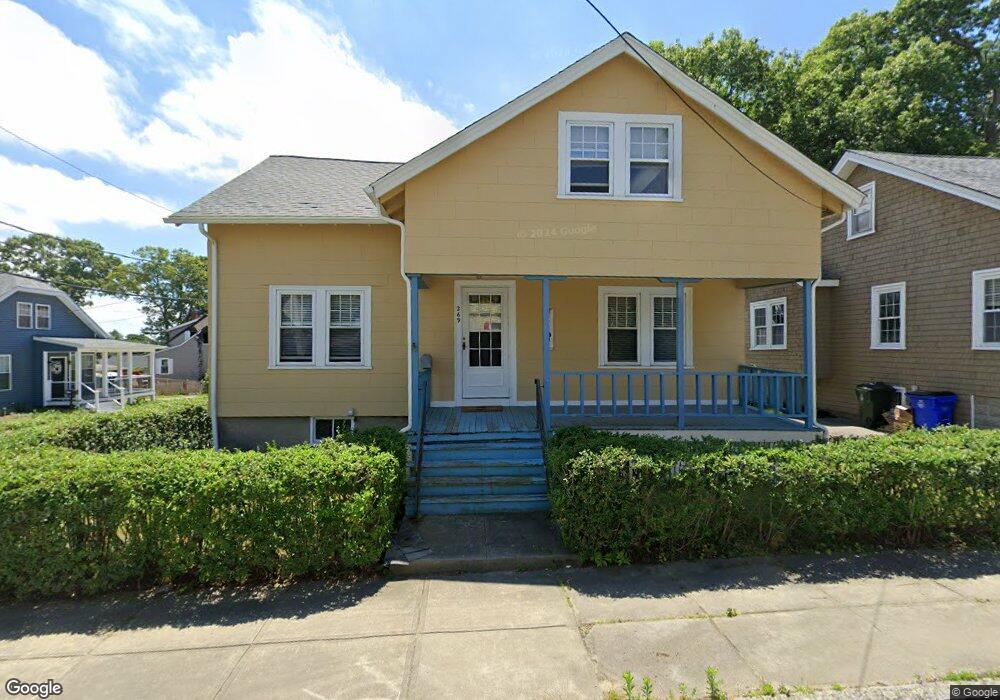
269 Cypress St Fall River, MA 02720
Highlands-Fall River NeighborhoodEstimated Value: $379,107 - $473,000
3
Beds
1
Bath
1,440
Sq Ft
$301/Sq Ft
Est. Value
About This Home
This home is located at 269 Cypress St, Fall River, MA 02720 and is currently estimated at $433,027, approximately $300 per square foot. 269 Cypress St is a home located in Bristol County with nearby schools including Spencer Borden Elementary School, Morton Middle School, and B M C Durfee High School.
Ownership History
Date
Name
Owned For
Owner Type
Purchase Details
Closed on
Aug 20, 1993
Sold by
Troia Benjamin S and Troia Jean F
Bought by
Silva Michael A and Silva Katherine M
Current Estimated Value
Create a Home Valuation Report for This Property
The Home Valuation Report is an in-depth analysis detailing your home's value as well as a comparison with similar homes in the area
Home Values in the Area
Average Home Value in this Area
Purchase History
| Date | Buyer | Sale Price | Title Company |
|---|---|---|---|
| Silva Michael A | $107,900 | -- |
Source: Public Records
Mortgage History
| Date | Status | Borrower | Loan Amount |
|---|---|---|---|
| Open | Silva Michael A | $132,600 | |
| Closed | Silva Michael A | $20,000 | |
| Closed | Silva Michael A | $99,500 | |
| Closed | Silva Michael A | $12,000 |
Source: Public Records
Tax History
| Year | Tax Paid | Tax Assessment Tax Assessment Total Assessment is a certain percentage of the fair market value that is determined by local assessors to be the total taxable value of land and additions on the property. | Land | Improvement |
|---|---|---|---|---|
| 2025 | $3,650 | $318,800 | $130,900 | $187,900 |
| 2024 | $3,462 | $301,300 | $125,900 | $175,400 |
| 2023 | $3,411 | $278,000 | $113,000 | $165,000 |
| 2022 | $3,065 | $242,900 | $104,600 | $138,300 |
| 2021 | $3,085 | $223,100 | $98,800 | $124,300 |
| 2020 | $2,916 | $201,800 | $95,100 | $106,700 |
| 2019 | $2,890 | $198,200 | $95,100 | $103,100 |
| 2018 | $2,921 | $199,800 | $95,100 | $104,700 |
| 2017 | $2,771 | $197,900 | $95,100 | $102,800 |
| 2016 | $2,627 | $192,700 | $95,100 | $97,600 |
| 2015 | $2,441 | $186,600 | $89,000 | $97,600 |
| 2014 | $2,347 | $186,600 | $89,000 | $97,600 |
Source: Public Records
Map
Nearby Homes
- 108 Garden St
- 49 Farnham St
- 742 New Boston Rd
- 25 O'Hearn St
- 301 Madison St
- 1231 Robeson St
- 677 Oak Grove Ave
- 65 Bigelow St
- 499 Hanover St
- 309 Doherty St
- 503 Highland Ave
- 45-47 Shawmut St
- 27 Kane St
- 545 Robeson St
- 1073 New Boston Rd
- 36 Fordney St
- 213 Weetamoe St
- 208 Florence St
- 376 N Underwood St
- 862 Locust St