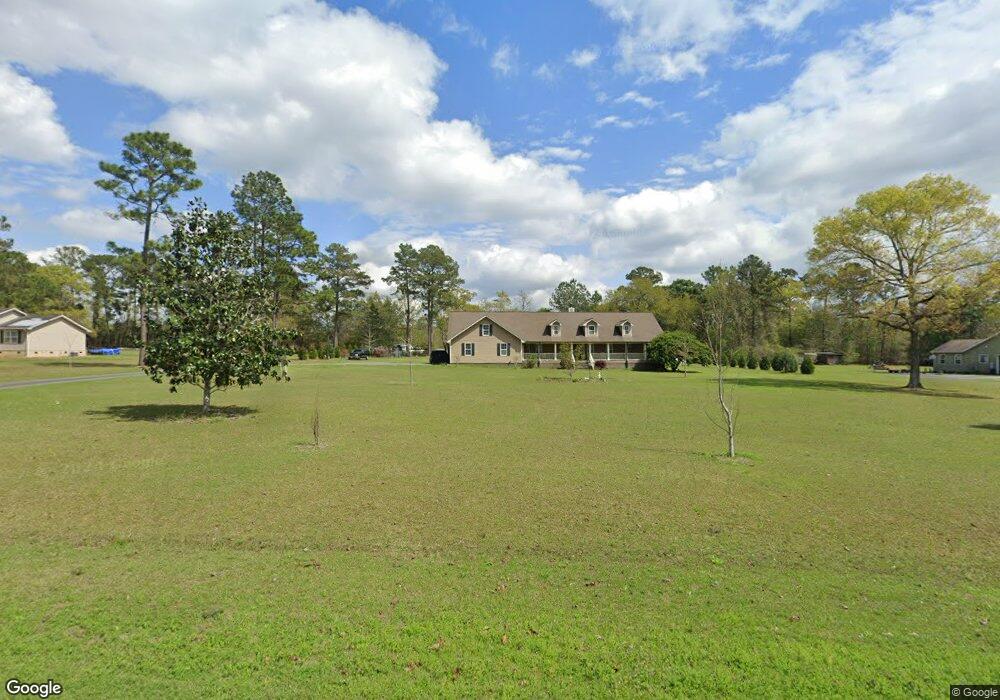
269 Due South Rd Whigham, GA 39897
Estimated Value: $171,000 - $352,000
3
Beds
4
Baths
2,346
Sq Ft
$116/Sq Ft
Est. Value
About This Home
This home is located at 269 Due South Rd, Whigham, GA 39897 and is currently estimated at $272,667, approximately $116 per square foot. 269 Due South Rd is a home located in Grady County.
Ownership History
Date
Name
Owned For
Owner Type
Purchase Details
Closed on
Jul 20, 2017
Bought by
Brinson Janice J and Brinson Jeffrey A
Current Estimated Value
Purchase Details
Closed on
Feb 7, 2017
Sold by
Harrell Mary F
Bought by
Synovus Bank
Purchase Details
Closed on
Jun 5, 2002
Bought by
Harrell Mary Frances
Purchase Details
Closed on
Dec 24, 1997
Sold by
Lacy Clay
Bought by
Cutchens Waymon
Purchase Details
Closed on
Jun 28, 1990
Bought by
Lacy Clay
Create a Home Valuation Report for This Property
The Home Valuation Report is an in-depth analysis detailing your home's value as well as a comparison with similar homes in the area
Home Values in the Area
Average Home Value in this Area
Purchase History
| Date | Buyer | Sale Price | Title Company |
|---|---|---|---|
| Brinson Janice J | $180,000 | -- | |
| Synovus Bank | $228,000 | -- | |
| Harrell Mary Frances | $22,500 | -- | |
| Cutchens Waymon | $8,200 | -- | |
| Lacy Clay | -- | -- |
Source: Public Records
Tax History Compared to Growth
Tax History
| Year | Tax Paid | Tax Assessment Tax Assessment Total Assessment is a certain percentage of the fair market value that is determined by local assessors to be the total taxable value of land and additions on the property. | Land | Improvement |
|---|---|---|---|---|
| 2024 | $4,013 | $132,456 | $6,120 | $126,336 |
| 2023 | $2,265 | $75,594 | $6,000 | $69,594 |
| 2022 | $2,327 | $75,594 | $6,000 | $69,594 |
| 2021 | $2,335 | $75,594 | $6,000 | $69,594 |
| 2020 | $2,343 | $75,594 | $6,000 | $69,594 |
| 2019 | $2,343 | $75,594 | $6,000 | $69,594 |
| 2018 | $2,199 | $75,594 | $6,000 | $69,594 |
| 2017 | $1,900 | $75,594 | $6,000 | $69,594 |
| 2016 | $1,617 | $65,106 | $6,000 | $59,106 |
| 2015 | $1,593 | $65,106 | $6,000 | $59,106 |
| 2014 | $1,592 | $65,106 | $6,000 | $59,106 |
| 2013 | -- | $63,889 | $6,000 | $57,889 |
Source: Public Records
Map
Nearby Homes
- 723 Providence Rd
- 267 Providence Rd
- 1718 Old 179 S
- 165 Larkin St
- 206 Lodge Ln
- 171 Council Ln
- 00 Tired Creek Rd
- 490 13th St SW
- 1385 Martin Luther King Junior Ave
- 0 Upper Hawthorne Trail
- 1137 Summerfield
- 786 Madison Ln
- 316 Faircloth Rd
- 000 1st Ave SW
- 1389 Lake Front Dr
- 425 8th St SW
- 320 8th St SW
- 1520 Upper Hawthorne Trail
- 7501 111 S
- 117 6th St SW
- 269 Due South Rd
- 249 Due South Rd
- 289 Due South Rd
- 268 Due Dr S
- 268 Due South Rd
- 248 Due South Rd
- 229 Due South Rd
- 288 Due South Rd
- 288 Due South Rd
- 288 Due Dr S
- 331 Due South Rd
- 209 Due South Rd
- 209 Due Dr S
- 236 Due South Rd
- 0 Due Dr S
- 000 Due Dr S
- 171 Due South Rd
- 880 Providence Rd
- 350 Due South Rd
- 894 Providence Rd