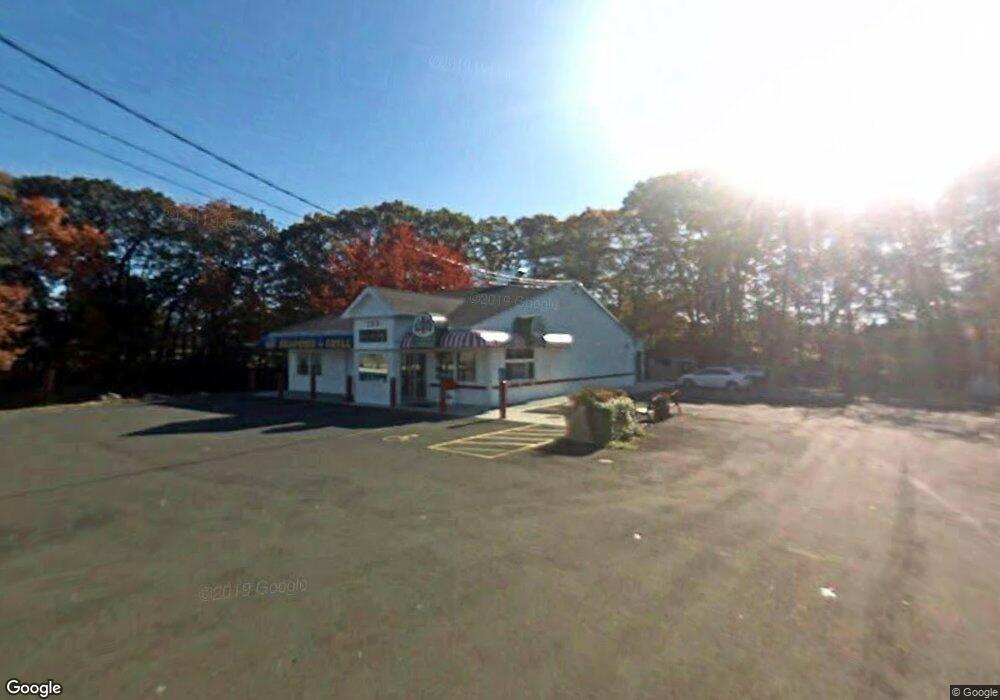
269 E Main St Branford, CT 06405
Estimated Value: $1,064,054
--
Bed
--
Bath
2,391
Sq Ft
$445/Sq Ft
Est. Value
About This Home
This home is located at 269 E Main St, Branford, CT 06405 and is currently estimated at $1,064,054, approximately $445 per square foot. 269 E Main St is a home located in New Haven County with nearby schools including Francis Walsh Intermediate School, Branford High School, and East Shoreline Catholic Academy.
Ownership History
Date
Name
Owned For
Owner Type
Purchase Details
Closed on
Apr 7, 2015
Sold by
Ralph Camputaro Llc
Bought by
Mascot Properties Llc
Current Estimated Value
Home Financials for this Owner
Home Financials are based on the most recent Mortgage that was taken out on this home.
Original Mortgage
$500,000
Outstanding Balance
$286,006
Interest Rate
3.75%
Mortgage Type
Commercial
Estimated Equity
$778,048
Purchase Details
Closed on
Sep 13, 2006
Sold by
Manning Vincent and Manning Rose M
Bought by
Ralph Camputaro Llc
Create a Home Valuation Report for This Property
The Home Valuation Report is an in-depth analysis detailing your home's value as well as a comparison with similar homes in the area
Home Values in the Area
Average Home Value in this Area
Purchase History
| Date | Buyer | Sale Price | Title Company |
|---|---|---|---|
| Mascot Properties Llc | $530,000 | -- | |
| Ralph Camputaro Llc | $555,000 | -- |
Source: Public Records
Mortgage History
| Date | Status | Borrower | Loan Amount |
|---|---|---|---|
| Open | Mascot Properties Llc | $500,000 | |
| Previous Owner | Ralph Camputaro Llc | $240,000 |
Source: Public Records
Tax History Compared to Growth
Tax History
| Year | Tax Paid | Tax Assessment Tax Assessment Total Assessment is a certain percentage of the fair market value that is determined by local assessors to be the total taxable value of land and additions on the property. | Land | Improvement |
|---|---|---|---|---|
| 2025 | $8,937 | $417,600 | $146,700 | $270,900 |
| 2024 | $10,817 | $354,900 | $145,400 | $209,500 |
| 2023 | $10,608 | $354,900 | $145,400 | $209,500 |
| 2022 | $10,452 | $354,900 | $145,400 | $209,500 |
| 2021 | $10,452 | $354,900 | $145,400 | $209,500 |
| 2020 | $10,264 | $354,900 | $145,400 | $209,500 |
| 2019 | $8,404 | $289,100 | $117,700 | $171,400 |
| 2018 | $8,280 | $289,100 | $117,700 | $171,400 |
| 2017 | $8,231 | $289,100 | $117,700 | $171,400 |
| 2016 | $7,924 | $289,100 | $117,700 | $171,400 |
| 2015 | $7,785 | $289,100 | $117,700 | $171,400 |
| 2014 | -- | $295,000 | $117,700 | $177,300 |
Source: Public Records
Map
Nearby Homes
- 251 N Main St
- 49 Riverside Dr
- 107 Chestnut St
- 16 Pine Orchard Rd Unit 23
- 21 Manorwood Dr Unit 21
- 85 Ivy St
- 24 River Walk
- 25 S Montowese St
- 86 Pine Orchard Rd
- 26 Cedar Knolls Dr
- 22 Hickory Hill Ln
- 10 Corbin Cir
- 62 S Montowese St
- 27 Hickory Hill Ln
- 226 Austin Ryer Ln Unit 226
- 240 Austin Ryer Ln Unit 240
- 60 Maple St Unit 40B
- 53 Brushy Plain Rd Unit 4E
- 53 Brushy Plain Rd Unit 3D
- 113 Island View Terrace