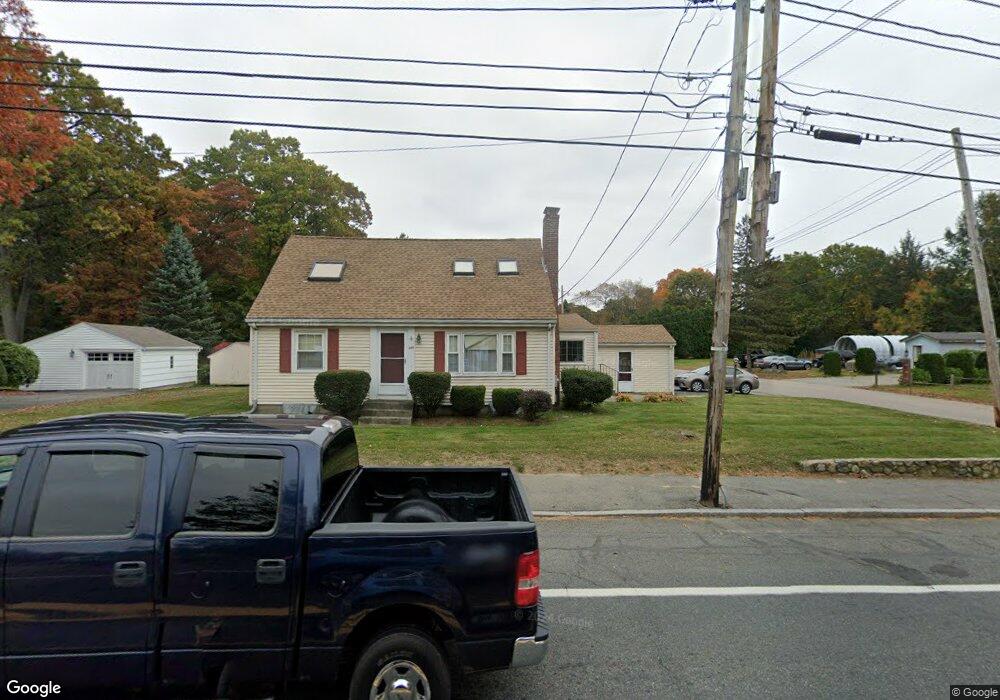
269 Elm St Framingham, MA 01701
Saxonville NeighborhoodEstimated Value: $586,000 - $672,000
4
Beds
2
Baths
1,496
Sq Ft
$430/Sq Ft
Est. Value
About This Home
This home is located at 269 Elm St, Framingham, MA 01701 and is currently estimated at $644,005, approximately $430 per square foot. 269 Elm St is a home located in Middlesex County with nearby schools including Framingham High School, Christa McAuliffe Charter School, and MetroWest Jewish Day School.
Ownership History
Date
Name
Owned For
Owner Type
Purchase Details
Closed on
Mar 29, 2022
Sold by
Halloran Michael V Est and Halloran
Bought by
Dunn Regina M and Halloran Richard F
Current Estimated Value
Purchase Details
Closed on
Jul 12, 2011
Sold by
King Joan M
Bought by
Halloran Richard F and Halloran Michael V
Purchase Details
Closed on
Feb 15, 1980
Bought by
King Joan M and Halloran Richard F
Create a Home Valuation Report for This Property
The Home Valuation Report is an in-depth analysis detailing your home's value as well as a comparison with similar homes in the area
Home Values in the Area
Average Home Value in this Area
Purchase History
| Date | Buyer | Sale Price | Title Company |
|---|---|---|---|
| Dunn Regina M | -- | None Available | |
| Dunn Regina M | -- | None Available | |
| Halloran Richard F | -- | -- | |
| Halloran Richard F | -- | -- | |
| King Joan M | -- | -- |
Source: Public Records
Mortgage History
| Date | Status | Borrower | Loan Amount |
|---|---|---|---|
| Previous Owner | King Joan M | $10,000 |
Source: Public Records
Tax History Compared to Growth
Tax History
| Year | Tax Paid | Tax Assessment Tax Assessment Total Assessment is a certain percentage of the fair market value that is determined by local assessors to be the total taxable value of land and additions on the property. | Land | Improvement |
|---|---|---|---|---|
| 2025 | $6,614 | $553,900 | $259,400 | $294,500 |
| 2024 | $6,616 | $531,000 | $231,600 | $299,400 |
| 2023 | $6,257 | $478,000 | $206,700 | $271,300 |
| 2022 | $5,919 | $430,800 | $187,600 | $243,200 |
| 2021 | $5,725 | $407,500 | $180,300 | $227,200 |
| 2020 | $5,773 | $385,400 | $163,800 | $221,600 |
| 2019 | $5,603 | $364,300 | $163,800 | $200,500 |
| 2018 | $5,484 | $336,000 | $157,700 | $178,300 |
| 2017 | $5,384 | $322,200 | $153,100 | $169,100 |
| 2016 | $5,407 | $311,100 | $153,100 | $158,000 |
| 2015 | $5,243 | $294,200 | $152,900 | $141,300 |
Source: Public Records
Map
Nearby Homes
- 24 Pinewood Dr
- 81 Nicholas Rd Unit B
- 71 Nicholas Rd Unit H
- 19 Park Ave
- 14 Francine Rd
- 8 Elm St Unit 8A
- 163 Water St
- 29 Derby St
- 154 Danforth St
- 11 Danforth Park Rd
- 63 Landham Rd
- 10 Victoria Garden Unit A
- 0 Wagonwheel Rd
- 82 Joseph Rd
- 84 Hopestill Brown Rd
- 217 Central St
- 454 Old Connecticut Path
- 36 Brownlea Rd
- 1376 Concord St
- 53 Davidson Rd