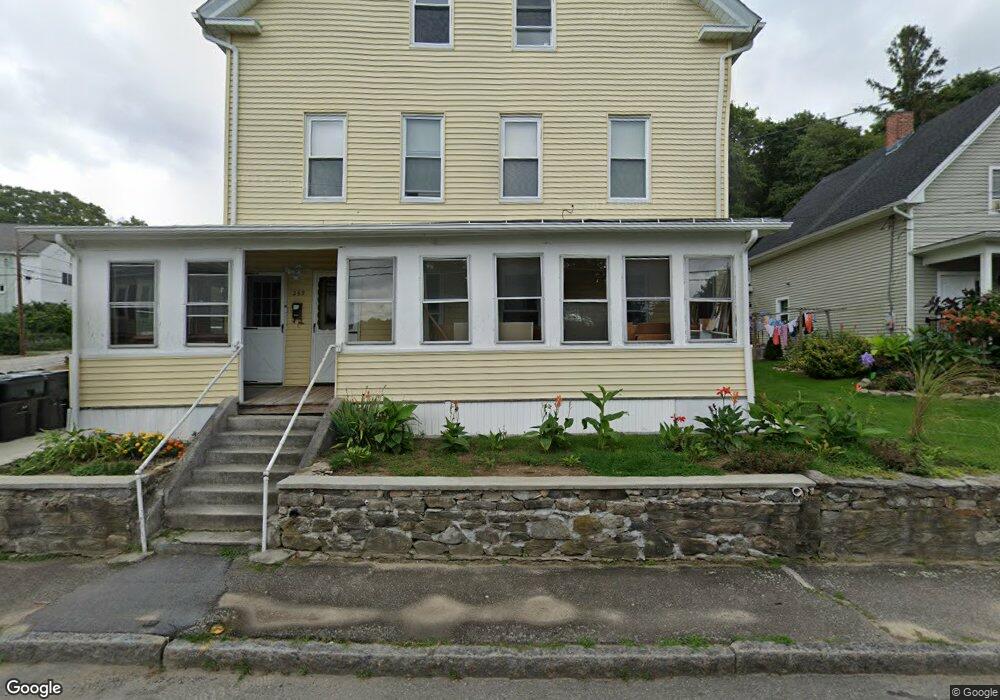
269 High St Webster, MA 01570
Estimated Value: $258,069 - $547,000
7
Beds
3
Baths
3,258
Sq Ft
$130/Sq Ft
Est. Value
About This Home
This home is located at 269 High St, Webster, MA 01570 and is currently estimated at $423,267, approximately $129 per square foot. 269 High St is a home located in Worcester County with nearby schools including Park Avenue Elementary School, Webster Middle School, and Bartlett High School.
Ownership History
Date
Name
Owned For
Owner Type
Purchase Details
Closed on
Jul 2, 2019
Sold by
Choice Reconstruction
Bought by
Biela Michal and Biela Joanna
Current Estimated Value
Purchase Details
Closed on
May 6, 2019
Sold by
Lafountain Mary J and Nationstar Mortgage Llc
Bought by
Choice Reconstruction
Create a Home Valuation Report for This Property
The Home Valuation Report is an in-depth analysis detailing your home's value as well as a comparison with similar homes in the area
Home Values in the Area
Average Home Value in this Area
Purchase History
| Date | Buyer | Sale Price | Title Company |
|---|---|---|---|
| Biela Michal | $160,000 | -- | |
| Biela Michal | $160,000 | -- | |
| Biela Michal | $160,000 | -- | |
| Choice Reconstruction | $116,000 | -- | |
| Choice Reconstruction | $116,000 | -- | |
| Choice Reconstruction | $116,000 | -- |
Source: Public Records
Tax History
| Year | Tax Paid | Tax Assessment Tax Assessment Total Assessment is a certain percentage of the fair market value that is determined by local assessors to be the total taxable value of land and additions on the property. | Land | Improvement |
|---|---|---|---|---|
| 2025 | $3,198 | $269,200 | $49,100 | $220,100 |
| 2024 | $3,060 | $251,200 | $47,200 | $204,000 |
| 2023 | $2,634 | $210,700 | $44,900 | $165,800 |
| 2022 | $2,630 | $188,400 | $43,600 | $144,800 |
| 2021 | $2,522 | $167,000 | $43,600 | $123,400 |
| 2020 | $1,926 | $127,900 | $43,600 | $84,300 |
| 2019 | $2,569 | $167,600 | $43,600 | $124,000 |
| 2018 | $2,252 | $146,300 | $43,600 | $102,700 |
| 2017 | $2,124 | $140,400 | $42,700 | $97,700 |
| 2016 | $2,126 | $140,400 | $42,700 | $97,700 |
| 2015 | $2,046 | $139,400 | $41,900 | $97,500 |
Source: Public Records
Map
Nearby Homes
Your Personal Tour Guide
Ask me questions while you tour the home.