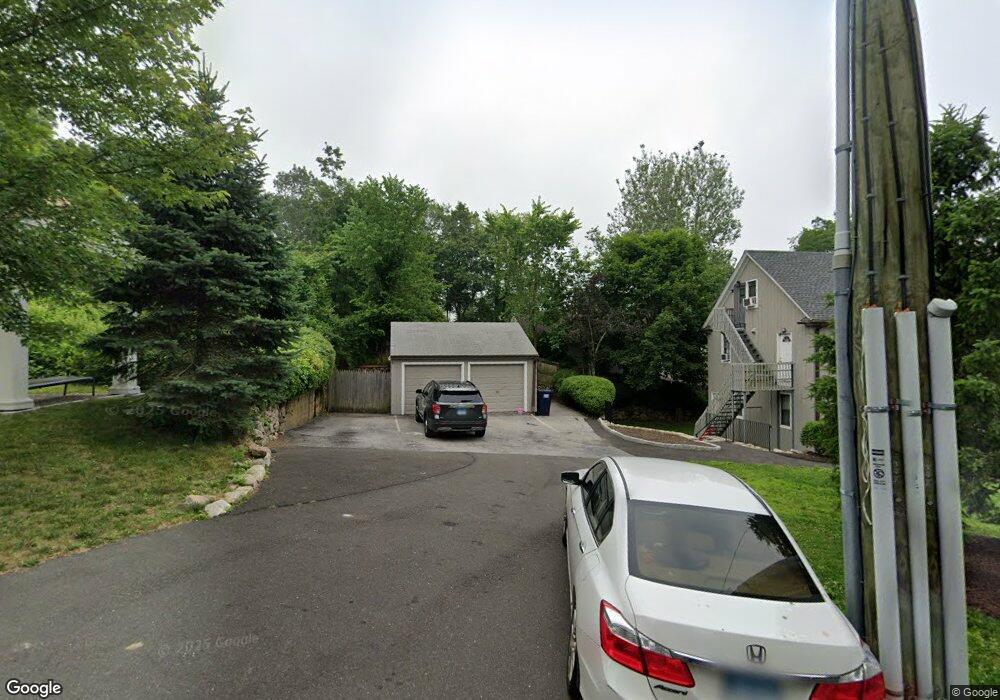
269 Hoyt St Darien, CT 06820
Estimated Value: $984,000 - $1,551,324
5
Beds
3
Baths
2,550
Sq Ft
$543/Sq Ft
Est. Value
About This Home
This home is located at 269 Hoyt St, Darien, CT 06820 and is currently estimated at $1,384,831, approximately $543 per square foot. 269 Hoyt St is a home located in Fairfield County with nearby schools including Ox Ridge Elementary School, Middlesex Middle School, and Darien High School.
Ownership History
Date
Name
Owned For
Owner Type
Purchase Details
Closed on
May 20, 2024
Sold by
269 Hoyt Street Llc
Bought by
Pacific On Hoyt St Llc
Current Estimated Value
Purchase Details
Closed on
Jan 21, 2016
Sold by
Zhang Qing and Luo Qian
Bought by
Sun Homes Darien Llc
Home Financials for this Owner
Home Financials are based on the most recent Mortgage that was taken out on this home.
Original Mortgage
$517,360
Interest Rate
1.5%
Purchase Details
Closed on
Oct 20, 2014
Sold by
Deutsche Bk Natl T Co
Bought by
Zhang Qing and Luo Qian
Purchase Details
Closed on
Feb 24, 2014
Sold by
Stevenson Jacinth
Bought by
Suntrust Mortgage Inc
Purchase Details
Closed on
Sep 6, 2006
Sold by
Pearson Stpehn E and Pearson Harriet P
Bought by
Stevenson Jacinth
Purchase Details
Closed on
Apr 26, 2004
Sold by
Csapilla Miklos R
Bought by
Pearson Stephen E and Pearson Harriet P
Create a Home Valuation Report for This Property
The Home Valuation Report is an in-depth analysis detailing your home's value as well as a comparison with similar homes in the area
Home Values in the Area
Average Home Value in this Area
Purchase History
| Date | Buyer | Sale Price | Title Company |
|---|---|---|---|
| Pacific On Hoyt St Llc | -- | None Available | |
| Pacific On Hoyt St Llc | -- | None Available | |
| Sun Homes Darien Llc | $892,000 | -- | |
| Sun Homes Darien Llc | $892,000 | -- | |
| Zhang Qing | $508,000 | -- | |
| Zhang Qing | $508,000 | -- | |
| Suntrust Mortgage Inc | -- | -- | |
| Suntrust Mortgage Inc | -- | -- | |
| Stevenson Jacinth | $715,000 | -- | |
| Stevenson Jacinth | $715,000 | -- | |
| Pearson Stephen E | $699,000 | -- | |
| Pearson Stephen E | $699,000 | -- |
Source: Public Records
Mortgage History
| Date | Status | Borrower | Loan Amount |
|---|---|---|---|
| Previous Owner | Pearson Stephen E | $517,360 |
Source: Public Records
Tax History Compared to Growth
Tax History
| Year | Tax Paid | Tax Assessment Tax Assessment Total Assessment is a certain percentage of the fair market value that is determined by local assessors to be the total taxable value of land and additions on the property. | Land | Improvement |
|---|---|---|---|---|
| 2025 | $5,281 | $341,180 | $223,440 | $117,740 |
| 2024 | $5,012 | $341,180 | $223,440 | $117,740 |
| 2023 | $4,687 | $266,140 | $178,710 | $87,430 |
| 2022 | $4,586 | $266,140 | $178,710 | $87,430 |
| 2021 | $4,482 | $266,140 | $178,710 | $87,430 |
| 2020 | $4,354 | $266,140 | $178,710 | $87,430 |
| 2019 | $4,383 | $266,140 | $178,710 | $87,430 |
| 2018 | $6,691 | $416,080 | $250,390 | $165,690 |
| 2017 | $6,724 | $416,080 | $250,390 | $165,690 |
| 2016 | $6,562 | $416,080 | $250,390 | $165,690 |
| 2015 | $6,387 | $416,080 | $250,390 | $165,690 |
| 2014 | $6,245 | $416,080 | $250,390 | $165,690 |
Source: Public Records
Map
Nearby Homes
- 32 Kensett Ln Unit 32
- 72 Kensett Ln
- 16 Columbus Place
- 41 Wakemore St
- 95 Columbus Place Unit 6
- 17 Oenoke Place
- 358 Hoyt St
- 23 Oenoke Place
- 11 Old Oak Rd
- 39 Woodway Rd Unit C7
- 19 Woodway Rd Unit 14
- 1157 Hope St
- 970 Hope St Unit 4J
- 27 Northill St Unit 3A
- 1148 Hope St
- 910 Hope St Unit 5B
- 900 Hope St Unit 8C
- 83 Mulberry St
- 44 Brundage St
- 825 Hope St Unit 4
- 269 Hoyt St Unit 2
- 269 Hoyt St Unit 1
- 269 Hoyt St Unit 3
- 267 Hoyt St
- 6 Wakemore St
- 265 Hoyt St
- 7 Wakemore St
- 12 Wakemore St
- 101 Kensett Ln
- 101 Kensett Ln Unit 101
- 101 Kensett Ln Unit 100
- 277 Hoyt St
- 263 Hoyt St
- 9 Wakemore St
- 279 Hoyt St
- 279 Hoyt St Unit 1
- 261 Hoyt St
- 22 Greenwood Ave
- 22R Greenwood Ave
- 24 Greenwood Ave