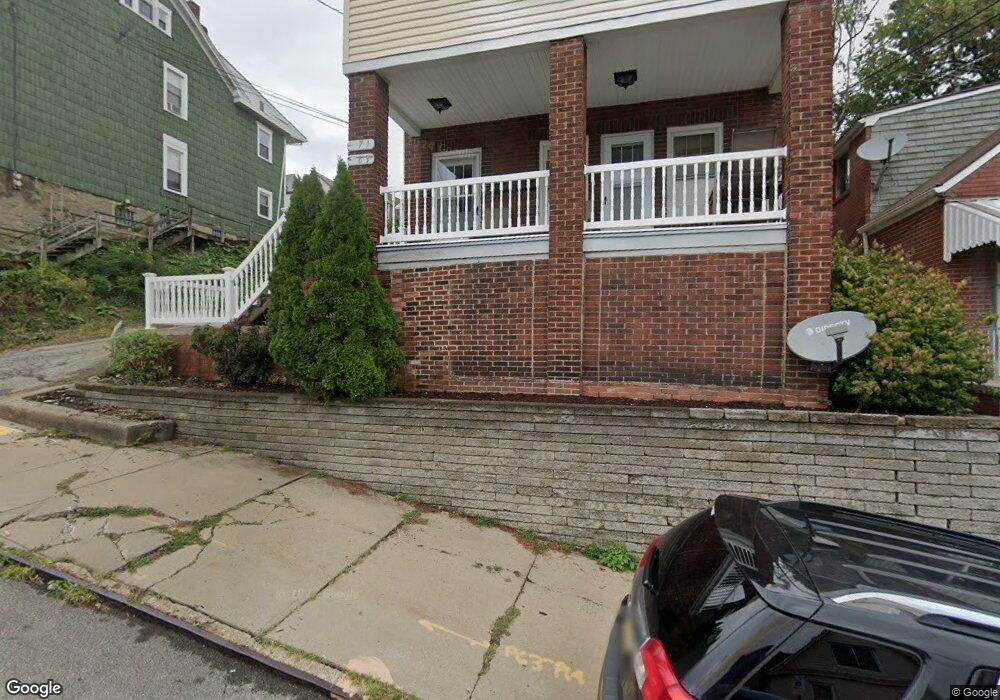
269 Lelia St Mount Washington, PA 15211
Mount Washington NeighborhoodEstimated Value: $252,000 - $309,783
4
Beds
2
Baths
2,283
Sq Ft
$123/Sq Ft
Est. Value
About This Home
This home is located at 269 Lelia St, Mount Washington, PA 15211 and is currently estimated at $280,946, approximately $123 per square foot. 269 Lelia St is a home located in Allegheny County with nearby schools including Pittsburgh Whittier K-5, South Hills Middle School, and Pittsburgh Brashear High School.
Ownership History
Date
Name
Owned For
Owner Type
Purchase Details
Closed on
Dec 28, 2023
Sold by
Moore Joseph C
Bought by
Mesich Zakary
Current Estimated Value
Home Financials for this Owner
Home Financials are based on the most recent Mortgage that was taken out on this home.
Original Mortgage
$270,019
Outstanding Balance
$265,485
Interest Rate
7.44%
Mortgage Type
New Conventional
Estimated Equity
$15,461
Purchase Details
Closed on
Dec 15, 2023
Sold by
Moore Joseph C
Bought by
Mesich Zakary
Home Financials for this Owner
Home Financials are based on the most recent Mortgage that was taken out on this home.
Original Mortgage
$270,019
Outstanding Balance
$265,485
Interest Rate
7.44%
Mortgage Type
New Conventional
Estimated Equity
$15,461
Purchase Details
Closed on
Jun 24, 2002
Sold by
Bruce David K and Bruce Kathleen M
Bought by
Bruce Kathleen M
Create a Home Valuation Report for This Property
The Home Valuation Report is an in-depth analysis detailing your home's value as well as a comparison with similar homes in the area
Home Values in the Area
Average Home Value in this Area
Purchase History
| Date | Buyer | Sale Price | Title Company |
|---|---|---|---|
| Mesich Zakary | $275,000 | -- | |
| Mesich Zakary | $275,000 | -- | |
| Bruce Kathleen M | -- | -- |
Source: Public Records
Mortgage History
| Date | Status | Borrower | Loan Amount |
|---|---|---|---|
| Open | Mesich Zakary | $270,019 |
Source: Public Records
Tax History Compared to Growth
Tax History
| Year | Tax Paid | Tax Assessment Tax Assessment Total Assessment is a certain percentage of the fair market value that is determined by local assessors to be the total taxable value of land and additions on the property. | Land | Improvement |
|---|---|---|---|---|
| 2025 | $1,299 | $56,400 | $14,100 | $42,300 |
| 2024 | $1,299 | $56,400 | $14,100 | $42,300 |
| 2023 | $1,299 | $56,400 | $14,100 | $42,300 |
| 2022 | $1,283 | $56,400 | $14,100 | $42,300 |
| 2021 | $1,297 | $56,400 | $14,100 | $42,300 |
| 2020 | $1,276 | $56,400 | $14,100 | $42,300 |
| 2019 | $1,276 | $56,400 | $14,100 | $42,300 |
| 2018 | $1,024 | $56,400 | $14,100 | $42,300 |
| 2017 | $1,276 | $56,400 | $14,100 | $42,300 |
| 2016 | $267 | $56,400 | $14,100 | $42,300 |
| 2015 | $267 | $56,400 | $14,100 | $42,300 |
| 2014 | $1,248 | $56,400 | $14,100 | $42,300 |
Source: Public Records
Map
Nearby Homes