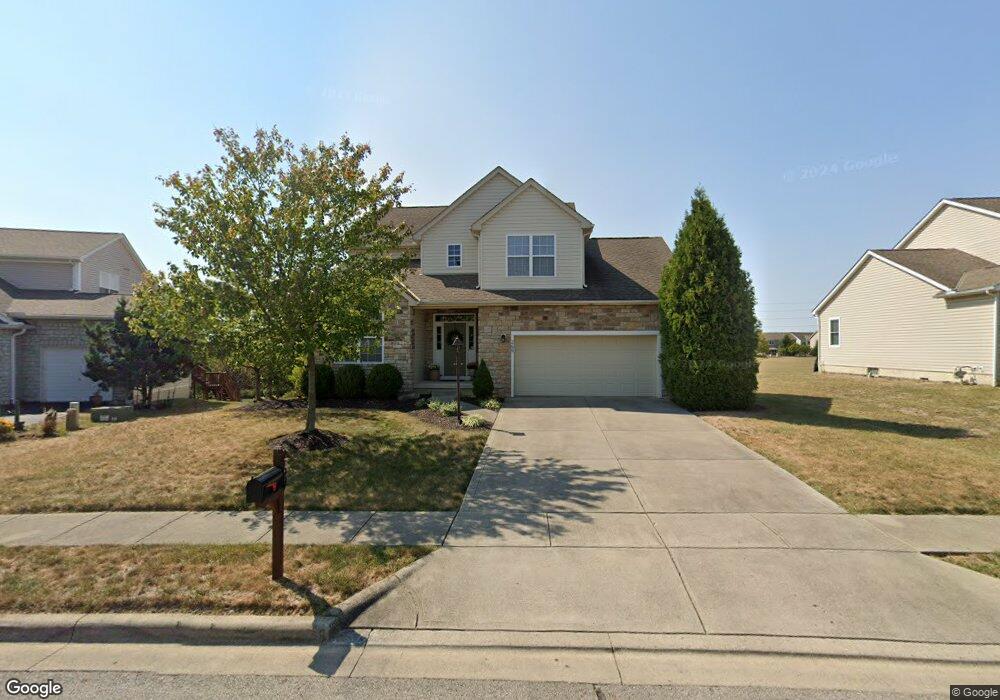
269 Lillian Dr Pickerington, OH 43147
Estimated Value: $414,527 - $470,000
4
Beds
3
Baths
2,388
Sq Ft
$185/Sq Ft
Est. Value
About This Home
This home is located at 269 Lillian Dr, Pickerington, OH 43147 and is currently estimated at $441,632, approximately $184 per square foot. 269 Lillian Dr is a home located in Fairfield County with nearby schools including Sycamore Creek Elementary School, Diley Middle School, and Pickerington Ridgeview Junior High School.
Ownership History
Date
Name
Owned For
Owner Type
Purchase Details
Closed on
Jul 2, 2007
Sold by
J & N Builders Llc
Bought by
Palkovich Shane D and Palkovich Jacqueline M
Current Estimated Value
Home Financials for this Owner
Home Financials are based on the most recent Mortgage that was taken out on this home.
Original Mortgage
$152,500
Outstanding Balance
$92,403
Interest Rate
6.37%
Mortgage Type
Purchase Money Mortgage
Estimated Equity
$349,229
Purchase Details
Closed on
May 15, 2006
Sold by
Dunmoor Investment Llc
Bought by
J & N Builders Llc
Home Financials for this Owner
Home Financials are based on the most recent Mortgage that was taken out on this home.
Original Mortgage
$194,900
Interest Rate
9.12%
Mortgage Type
Purchase Money Mortgage
Create a Home Valuation Report for This Property
The Home Valuation Report is an in-depth analysis detailing your home's value as well as a comparison with similar homes in the area
Home Values in the Area
Average Home Value in this Area
Purchase History
| Date | Buyer | Sale Price | Title Company |
|---|---|---|---|
| Palkovich Shane D | $227,500 | Attorney | |
| J & N Builders Llc | $42,000 | None Available |
Source: Public Records
Mortgage History
| Date | Status | Borrower | Loan Amount |
|---|---|---|---|
| Open | Palkovich Shane D | $152,500 | |
| Previous Owner | J & N Builders Llc | $194,900 |
Source: Public Records
Tax History
| Year | Tax Paid | Tax Assessment Tax Assessment Total Assessment is a certain percentage of the fair market value that is determined by local assessors to be the total taxable value of land and additions on the property. | Land | Improvement |
|---|---|---|---|---|
| 2025 | $13,663 | $129,910 | $30,750 | $99,160 |
| 2024 | $13,663 | $110,990 | $17,680 | $93,310 |
| 2023 | $5,233 | $110,990 | $17,680 | $93,310 |
| 2022 | $5,250 | $110,990 | $17,680 | $93,310 |
| 2021 | $4,826 | $86,890 | $15,380 | $71,510 |
| 2020 | $4,879 | $86,890 | $15,380 | $71,510 |
| 2019 | $4,909 | $86,890 | $15,380 | $71,510 |
| 2018 | $4,686 | $74,290 | $15,380 | $58,910 |
| 2017 | $4,692 | $72,290 | $13,380 | $58,910 |
| 2016 | $4,669 | $72,290 | $13,380 | $58,910 |
| 2015 | $4,604 | $67,410 | $13,380 | $54,030 |
| 2014 | $4,549 | $67,410 | $13,380 | $54,030 |
| 2013 | $4,549 | $67,410 | $13,380 | $54,030 |
Source: Public Records
Map
Nearby Homes
- 223 Antrim St
- 608 Exeter St
- 12196 Taylors Way
- 217 Warbler Ct
- 212 Partridge Ct
- 115 Kenton Ct
- 143 Cinnamon Teal St
- 108 Gold Finch St
- 116 Gold Finch St
- 216 Painter St
- 213 Painter St
- 125 Gold Finch St
- 620 Brighton St
- 563 Banbridge St
- 139 Gold Finch St
- 108 Sourwood St
- 648 Brevard Cir
- 270 Linden Cir
- 431 Vanderbuilt St
- 371 Field Harvest Ave
Your Personal Tour Guide
Ask me questions while you tour the home.