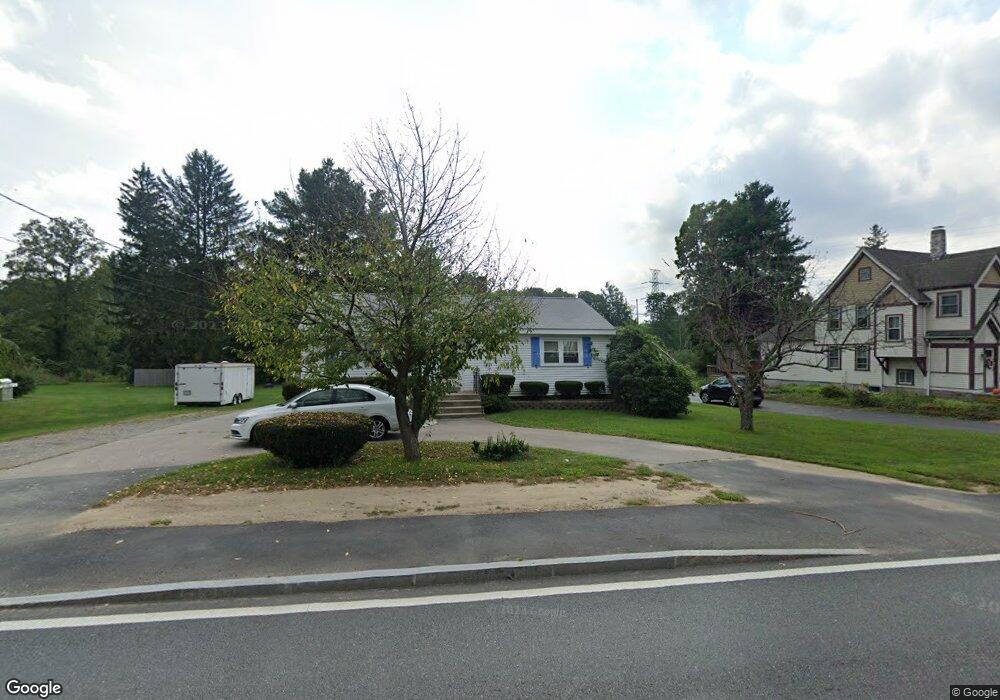
269 Main St Medway, MA 02053
Estimated Value: $464,000 - $484,148
3
Beds
1
Bath
1,260
Sq Ft
$378/Sq Ft
Est. Value
About This Home
This home is located at 269 Main St, Medway, MA 02053 and is currently estimated at $476,037, approximately $377 per square foot. 269 Main St is a home located in Norfolk County with nearby schools including John D. McGovern Elementary School, Burke-Memorial Elementary, and Medway Middle School.
Ownership History
Date
Name
Owned For
Owner Type
Purchase Details
Closed on
Oct 7, 2025
Sold by
Mccarthy John E
Bought by
John E Mccarthy T E and John Mccarthy
Current Estimated Value
Purchase Details
Closed on
Sep 3, 2008
Sold by
Desmarais Ft and Desmarais
Bought by
Mccarthy John and Mccarthy John E
Home Financials for this Owner
Home Financials are based on the most recent Mortgage that was taken out on this home.
Original Mortgage
$239,190
Interest Rate
6.69%
Mortgage Type
Purchase Money Mortgage
Purchase Details
Closed on
Feb 1, 1996
Sold by
Gately John F and Gately Donna M
Bought by
Desmarais Ft
Create a Home Valuation Report for This Property
The Home Valuation Report is an in-depth analysis detailing your home's value as well as a comparison with similar homes in the area
Home Values in the Area
Average Home Value in this Area
Purchase History
| Date | Buyer | Sale Price | Title Company |
|---|---|---|---|
| John E Mccarthy T E | -- | -- | |
| Mccarthy John | $239,900 | -- | |
| Mccarthy John | $239,900 | -- | |
| Mccarthy John | $239,900 | -- | |
| Desmarais Ft | $129,000 | -- |
Source: Public Records
Mortgage History
| Date | Status | Borrower | Loan Amount |
|---|---|---|---|
| Previous Owner | Desmarais Ft | $242,370 | |
| Previous Owner | Desmarais Ft | $242,182 | |
| Previous Owner | Mccarthy John | $239,190 |
Source: Public Records
Tax History Compared to Growth
Tax History
| Year | Tax Paid | Tax Assessment Tax Assessment Total Assessment is a certain percentage of the fair market value that is determined by local assessors to be the total taxable value of land and additions on the property. | Land | Improvement |
|---|---|---|---|---|
| 2025 | $5,465 | $383,500 | $240,700 | $142,800 |
| 2024 | $5,522 | $383,500 | $240,700 | $142,800 |
| 2023 | $5,204 | $326,500 | $210,100 | $116,400 |
| 2022 | $4,962 | $293,100 | $177,700 | $115,400 |
| 2021 | $4,594 | $263,100 | $160,500 | $102,600 |
| 2020 | $4,569 | $261,100 | $147,300 | $113,800 |
| 2019 | $4,580 | $269,900 | $159,300 | $110,600 |
| 2018 | $4,062 | $230,000 | $119,400 | $110,600 |
| 2017 | $4,068 | $227,000 | $119,400 | $107,600 |
| 2016 | $3,751 | $207,100 | $99,500 | $107,600 |
| 2015 | $3,778 | $207,100 | $99,500 | $107,600 |
| 2014 | $3,996 | $212,100 | $114,800 | $97,300 |
Source: Public Records
Map
Nearby Homes
- 462 Hartford Ave
- 455 Hartford Ave
- 39 West St
- 0 Old Log Lane (Farm St) Unit 73416329
- 220 Main St Unit 220
- 5 Fales St
- 6 Freedom Trail
- 18 Mary Anne Dr
- 21 Riverside Rd
- 387 Hartford Ave
- 14 Hawthorne Village Unit D
- 9 Tulip Way
- 28 Wellington St
- 176 Main St Unit 3
- 22 Granite St
- 951 Pond St
- 4 Shaw St
- 6 Rainbow Dr
- 280 Village St Unit D2
- 4 Deerfield Rd