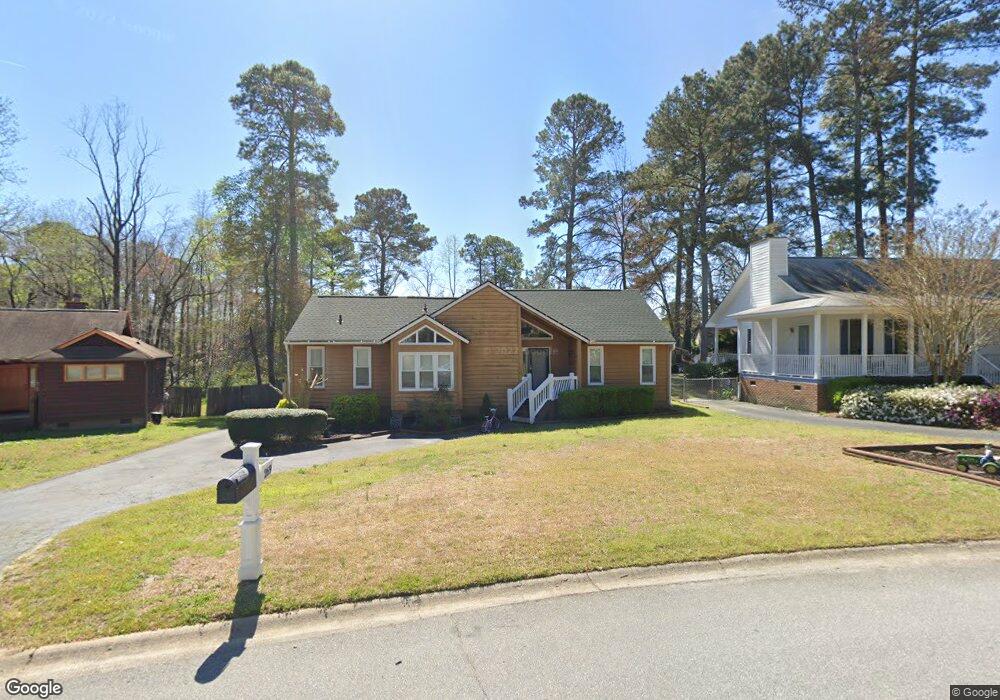
269 Mockingbird Cir Lexington, SC 29073
Estimated Value: $209,414 - $225,000
3
Beds
2
Baths
1,349
Sq Ft
$162/Sq Ft
Est. Value
About This Home
This home is located at 269 Mockingbird Cir, Lexington, SC 29073 and is currently estimated at $218,854, approximately $162 per square foot. 269 Mockingbird Cir is a home located in Lexington County with nearby schools including Red Bank Elementary School, Carolina Springs Middle School, and White Knoll High School.
Ownership History
Date
Name
Owned For
Owner Type
Purchase Details
Closed on
Dec 23, 2013
Sold by
Equity Trust Company
Bought by
Jeffcoat Robert J
Current Estimated Value
Home Financials for this Owner
Home Financials are based on the most recent Mortgage that was taken out on this home.
Original Mortgage
$99,750
Outstanding Balance
$74,674
Interest Rate
4.25%
Mortgage Type
Future Advance Clause Open End Mortgage
Estimated Equity
$144,180
Purchase Details
Closed on
Aug 21, 2013
Sold by
Jackson La Jessica and Bank Of America Na
Bought by
Equity Trust Company and Derrick A Learn Ira
Purchase Details
Closed on
Apr 29, 2009
Sold by
Kallman Christopher
Bought by
Jackson La J
Home Financials for this Owner
Home Financials are based on the most recent Mortgage that was taken out on this home.
Original Mortgage
$94,500
Interest Rate
4.79%
Mortgage Type
Future Advance Clause Open End Mortgage
Purchase Details
Closed on
Jun 28, 2002
Sold by
Steepe Rob C
Bought by
Kallman Chris
Purchase Details
Closed on
Jun 25, 2002
Sold by
Krest Invest Llc
Bought by
Sargent Veda D
Create a Home Valuation Report for This Property
The Home Valuation Report is an in-depth analysis detailing your home's value as well as a comparison with similar homes in the area
Home Values in the Area
Average Home Value in this Area
Purchase History
| Date | Buyer | Sale Price | Title Company |
|---|---|---|---|
| Jeffcoat Robert J | $105,000 | -- | |
| Equity Trust Company | $58,000 | -- | |
| Jackson La J | $105,000 | -- | |
| Kallman Chris | $93,500 | -- | |
| Sargent Veda D | $79,999 | -- |
Source: Public Records
Mortgage History
| Date | Status | Borrower | Loan Amount |
|---|---|---|---|
| Open | Jeffcoat Robert J | $99,750 | |
| Previous Owner | Jackson La J | $94,500 |
Source: Public Records
Tax History
| Year | Tax Paid | Tax Assessment Tax Assessment Total Assessment is a certain percentage of the fair market value that is determined by local assessors to be the total taxable value of land and additions on the property. | Land | Improvement |
|---|---|---|---|---|
| 2024 | $770 | $4,722 | $1,009 | $3,713 |
| 2023 | $705 | $4,722 | $1,009 | $3,713 |
| 2022 | $703 | $4,722 | $1,009 | $3,713 |
| 2020 | $721 | $4,722 | $1,009 | $3,713 |
| 2019 | $639 | $4,107 | $880 | $3,227 |
| 2018 | $627 | $4,107 | $880 | $3,227 |
| 2017 | $608 | $4,107 | $880 | $3,227 |
| 2016 | $603 | $4,106 | $880 | $3,226 |
| 2014 | $589 | $4,199 | $720 | $3,479 |
| 2013 | -- | $6,300 | $1,080 | $5,220 |
Source: Public Records
Map
Nearby Homes
- 209 Maple Tree Ct
- 318 W Pond Ct
- 182 Secretariat St
- 178 Secretariat St
- 664 Westwood Dr
- 117 New Market Cir
- 416 Pin Oak Dr
- 159 Darian Dr
- 608 Thunder Gulch Ave
- 612 Thunder Gulch Ave
- 620 Thunder Gulch Ave
- 624 Thunder Gulch Ave
- 628 Thunder Gulch Ave
- 611 Thunder Gulch Ave
- 672 Deertrack Run
- 447 Finch Ln
- 623 Thunder Gulch Ave
- 146 Darian Dr
- 221 Colony Lakes Dr
- 912 Dovefield Ln
- 271 Mockingbird Cir
- 267 Mockingbird Cir
- 105 Mockingbird Ct
- 273 Mockingbird Cir
- 265 Mockingbird Cir
- 148 Mockingbird Dr
- 270 Mockingbird Cir
- 206 Mockingbird Dr
- 263 Mockingbird Cir
- 107 Mockingbird Ct
- 210 Mockingbird Dr
- 260 Mockingbird Cir
- 261 Mockingbird Cir
- 149 Mockingbird Dr
- 151 Mockingbird Dr
- 554 Pin Oak Dr
- 212 Mockingbird Dr
- 205 Mockingbird Dr
- 558 Pin Oak Dr
- 142 Mockingbird Dr
Your Personal Tour Guide
Ask me questions while you tour the home.