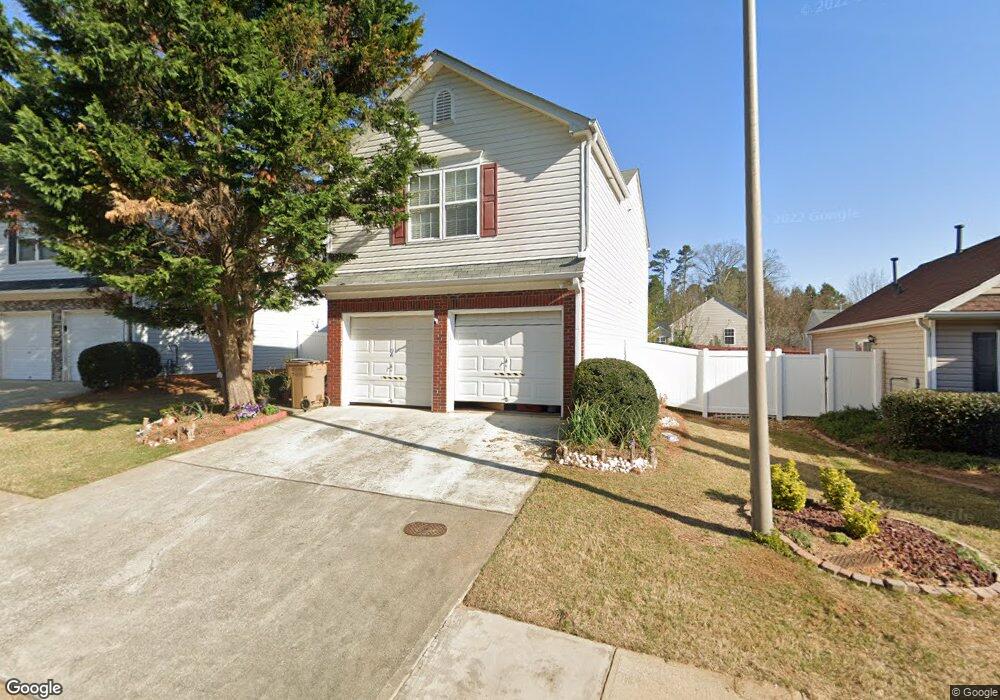
269 Oak Grove Way Acworth, GA 30102
Oak Grove NeighborhoodEstimated Value: $316,000
3
Beds
3
Baths
1,360
Sq Ft
$232/Sq Ft
Est. Value
About This Home
This home is located at 269 Oak Grove Way, Acworth, GA 30102 and is currently estimated at $316,000, approximately $232 per square foot. 269 Oak Grove Way is a home located in Cherokee County with nearby schools including Oak Grove Elementary School, E. T. Booth Middle School, and Etowah High School.
Ownership History
Date
Name
Owned For
Owner Type
Purchase Details
Closed on
May 26, 2010
Sold by
Mistretta James M and Mistretta Sandra C
Bought by
Pareja Christian I
Current Estimated Value
Home Financials for this Owner
Home Financials are based on the most recent Mortgage that was taken out on this home.
Original Mortgage
$128,310
Outstanding Balance
$85,459
Interest Rate
5%
Mortgage Type
FHA
Estimated Equity
$230,541
Purchase Details
Closed on
Nov 13, 2008
Sold by
Fremont Homes Series 2004-3
Bought by
Mistretta James M and Mistretta Sandra C
Home Financials for this Owner
Home Financials are based on the most recent Mortgage that was taken out on this home.
Original Mortgage
$72,800
Interest Rate
5.63%
Mortgage Type
New Conventional
Purchase Details
Closed on
Jun 3, 2008
Sold by
Flowers Morris and Flowers Nailah
Bought by
Fremont Hm Loan Series 2004-3
Purchase Details
Closed on
May 16, 2001
Sold by
Colony Homes Llc
Bought by
Headen Nailah E
Home Financials for this Owner
Home Financials are based on the most recent Mortgage that was taken out on this home.
Original Mortgage
$111,750
Interest Rate
6.87%
Mortgage Type
FHA
Create a Home Valuation Report for This Property
The Home Valuation Report is an in-depth analysis detailing your home's value as well as a comparison with similar homes in the area
Home Values in the Area
Average Home Value in this Area
Purchase History
| Date | Buyer | Sale Price | Title Company |
|---|---|---|---|
| Pareja Christian I | $131,300 | -- | |
| Mistretta James M | $91,000 | -- | |
| Fremont Hm Loan Series 2004-3 | $131,372 | -- | |
| Headen Nailah E | $112,700 | -- |
Source: Public Records
Mortgage History
| Date | Status | Borrower | Loan Amount |
|---|---|---|---|
| Open | Pareja Christian I | $128,310 | |
| Previous Owner | Mistretta James M | $72,800 | |
| Previous Owner | Headen Nailah E | $111,750 |
Source: Public Records
Tax History Compared to Growth
Tax History
| Year | Tax Paid | Tax Assessment Tax Assessment Total Assessment is a certain percentage of the fair market value that is determined by local assessors to be the total taxable value of land and additions on the property. | Land | Improvement |
|---|---|---|---|---|
| 2025 | $3,298 | $125,596 | $21,600 | $103,996 |
| 2024 | $3,332 | $128,236 | $24,000 | $104,236 |
| 2023 | $3,261 | $125,480 | $24,000 | $101,480 |
| 2022 | $2,544 | $96,800 | $16,000 | $80,800 |
| 2021 | $2,343 | $82,520 | $16,000 | $66,520 |
| 2020 | $2,006 | $70,600 | $14,000 | $56,600 |
| 2019 | $1,852 | $65,160 | $12,800 | $52,360 |
| 2018 | $1,704 | $59,600 | $10,400 | $49,200 |
| 2017 | $1,676 | $145,400 | $10,400 | $47,760 |
| 2016 | $1,586 | $136,200 | $10,400 | $44,080 |
| 2015 | $1,426 | $121,300 | $9,200 | $39,320 |
| 2014 | $1,363 | $115,700 | $9,200 | $37,080 |
Source: Public Records
Map
Nearby Homes
- 271 Oak Grove Way
- 626 Spanish Oak Dr
- 402 Royal Oak Dr
- 636 Spanish Oak Dr
- 423 Royal Oak Dr
- 4645 Highway 92
- 313 Maltibie Dr
- 100 Creekwood Trail
- 4771 Highway 92
- 108 Creekwood Trail
- 4915 Highway 92
- 0 W Hwy 92 Unit 7354851
- 1768 Balsa Ln
- 5574 Oak Grove Dr
- 6312 Woodstock Rd
- 585 Lee Dr
- 577 Oakside Place
- 400 Sable Trace Cove
- 166 Woodhouse Cir
- 240 Ridge Mill Dr
- 267 Oak Grove Way
- 271 Oak Grove Way Unit 36A
- 273 Oak Grove Way
- 265 Oak Grove Way
- 507 Oakleaf Ct Unit 507
- 507 Oakleaf Ct Unit 5
- 509 Oakleaf Ct
- 511 Oakleaf Ct Unit 5
- 505 Oakleaf Ct Unit 505
- 505 Oakleaf Ct
- 275 Oak Grove Way
- 250 Oak Grove Way
- 263 Oak Grove Way
- 252 Oak Grove Way
- 248 Oak Grove Way Unit 2
- 513 Oakleaf Ct Unit 5
- 503 Oakleaf Ct
- 254 Oak Grove Way Unit 2
- 246 Oak Grove Way
- 515 Oakleaf Ct Unit 5