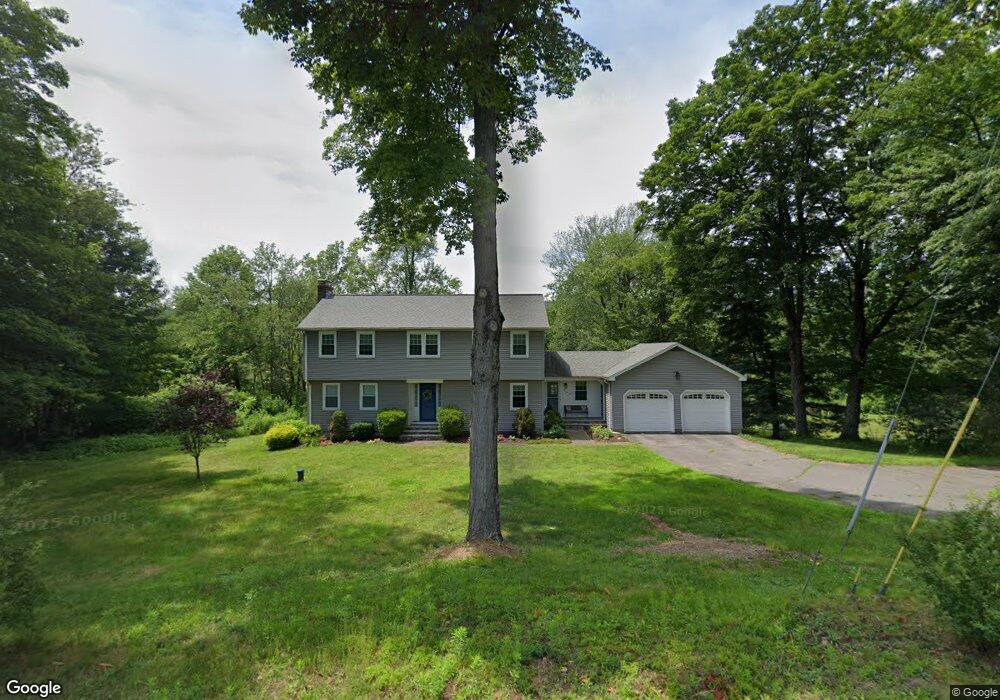
269 S Stone St West Suffield, CT 06093
Estimated Value: $460,000 - $518,000
5
Beds
3
Baths
2,126
Sq Ft
$228/Sq Ft
Est. Value
About This Home
This home is located at 269 S Stone St, West Suffield, CT 06093 and is currently estimated at $485,648, approximately $228 per square foot. 269 S Stone St is a home located in Hartford County with nearby schools including A. Ward Spaulding School, Mcalister Intermediate School, and Suffield Middle School.
Ownership History
Date
Name
Owned For
Owner Type
Purchase Details
Closed on
Dec 12, 1991
Sold by
Kasabian Rose Est
Bought by
Tustin Daniel and Tustin Judith
Current Estimated Value
Home Financials for this Owner
Home Financials are based on the most recent Mortgage that was taken out on this home.
Original Mortgage
$102,000
Interest Rate
8.73%
Mortgage Type
Unknown
Create a Home Valuation Report for This Property
The Home Valuation Report is an in-depth analysis detailing your home's value as well as a comparison with similar homes in the area
Home Values in the Area
Average Home Value in this Area
Purchase History
| Date | Buyer | Sale Price | Title Company |
|---|---|---|---|
| Tustin Daniel | $177,000 | -- |
Source: Public Records
Mortgage History
| Date | Status | Borrower | Loan Amount |
|---|---|---|---|
| Open | Tustin Daniel | $54,000 | |
| Closed | Tustin Daniel | $54,000 | |
| Closed | Tustin Daniel | $102,000 |
Source: Public Records
Tax History Compared to Growth
Tax History
| Year | Tax Paid | Tax Assessment Tax Assessment Total Assessment is a certain percentage of the fair market value that is determined by local assessors to be the total taxable value of land and additions on the property. | Land | Improvement |
|---|---|---|---|---|
| 2025 | $6,314 | $269,710 | $67,340 | $202,370 |
| 2024 | $5,956 | $263,200 | $67,340 | $195,860 |
| 2023 | $5,543 | $193,760 | $67,340 | $126,420 |
| 2022 | $5,543 | $193,760 | $67,340 | $126,420 |
| 2021 | $5,549 | $193,760 | $67,340 | $126,420 |
| 2020 | $5,549 | $193,760 | $67,340 | $126,420 |
| 2019 | $5,565 | $193,760 | $67,340 | $126,420 |
| 2018 | $5,535 | $188,790 | $65,170 | $123,620 |
| 2017 | $5,454 | $188,790 | $65,170 | $123,620 |
| 2016 | $5,324 | $188,790 | $65,170 | $123,620 |
| 2015 | $5,245 | $188,790 | $65,170 | $123,620 |
| 2014 | $5,120 | $188,790 | $65,170 | $123,620 |
Source: Public Records
Map
Nearby Homes
- 410 S Stone St
- 200 N Main St
- 10 Metacomet Ln
- 02 S Grand St
- 01 S Grand St
- 24 Coppergate Rd
- 106 N Main St
- 2 Plantation Dr
- 2 Stratton Farms Rd
- 100 Wheeler Dr
- 85 East St
- 218 Griffin Rd
- 879 Russell Ave
- 21 Newgate Rd
- 10 Russell Rd
- 18 Daniel Cir Unit 18
- 371 Lakeview Dr
- 91 Turkey Hills Rd
- 6 Fiddlehead Place
- 72 Spencer St