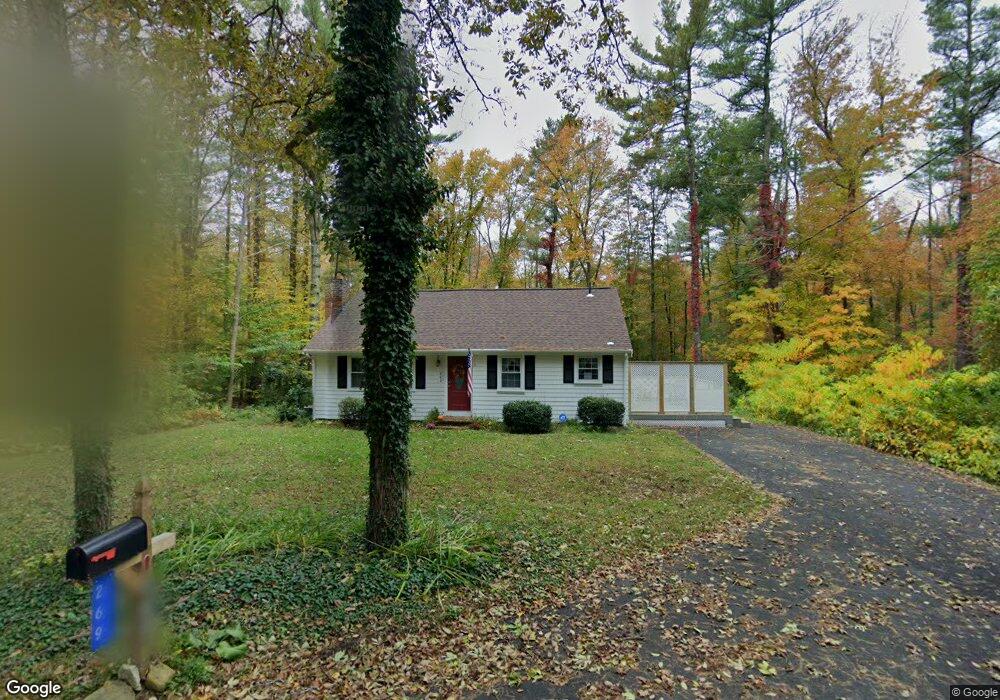
269 South St West Bridgewater, MA 02379
Estimated Value: $502,000 - $600,000
3
Beds
2
Baths
1,500
Sq Ft
$365/Sq Ft
Est. Value
About This Home
This home is located at 269 South St, West Bridgewater, MA 02379 and is currently estimated at $548,006, approximately $365 per square foot. 269 South St is a home located in Plymouth County with nearby schools including Spring Street Elementary School, Howard Elementary School, and Rose L. MacDonald Elementary School.
Ownership History
Date
Name
Owned For
Owner Type
Purchase Details
Closed on
Apr 30, 2003
Sold by
Sullivan Mark J and Sullivan Laurie L
Bought by
Marble Joyce E
Current Estimated Value
Purchase Details
Closed on
Aug 6, 1999
Sold by
Woodford James P and Woodford Maureen F
Bought by
Sullivan Mark J and Sullivan Laurie L
Purchase Details
Closed on
Jul 25, 1996
Sold by
Driscoll David F and Driscoll Mary B
Bought by
Woodford James P and Woodford Maureen F
Create a Home Valuation Report for This Property
The Home Valuation Report is an in-depth analysis detailing your home's value as well as a comparison with similar homes in the area
Home Values in the Area
Average Home Value in this Area
Purchase History
| Date | Buyer | Sale Price | Title Company |
|---|---|---|---|
| Marble Joyce E | $289,900 | -- | |
| Sullivan Mark J | $174,000 | -- | |
| Woodford James P | $139,900 | -- |
Source: Public Records
Mortgage History
| Date | Status | Borrower | Loan Amount |
|---|---|---|---|
| Open | Woodford James P | $95,000 | |
| Closed | Woodford James P | $75,000 |
Source: Public Records
Tax History Compared to Growth
Tax History
| Year | Tax Paid | Tax Assessment Tax Assessment Total Assessment is a certain percentage of the fair market value that is determined by local assessors to be the total taxable value of land and additions on the property. | Land | Improvement |
|---|---|---|---|---|
| 2025 | $5,668 | $414,600 | $207,200 | $207,400 |
| 2024 | $5,275 | $372,300 | $189,100 | $183,200 |
| 2023 | $5,091 | $331,200 | $169,100 | $162,100 |
| 2022 | $4,997 | $308,100 | $156,300 | $151,800 |
| 2021 | $76 | $285,700 | $149,100 | $136,600 |
| 2020 | $12,828 | $285,700 | $149,100 | $136,600 |
| 2019 | $4,686 | $283,500 | $149,100 | $134,400 |
| 2018 | $4,448 | $262,700 | $160,400 | $102,300 |
| 2017 | $4,409 | $248,700 | $149,700 | $99,000 |
| 2016 | $4,361 | $242,300 | $143,300 | $99,000 |
| 2015 | $4,210 | $236,400 | $143,300 | $93,100 |
| 2014 | $3,725 | $225,900 | $135,200 | $90,700 |
Source: Public Records
Map
Nearby Homes
- 30 Keenan St
- 18 Aldrich Rd
- 116 Center St
- 10 College Rd
- 192 S Main St
- 10 Duck Farm Ln
- Lot 2 Fontana Way
- 248 Center St Unit 7
- 92 Bryant St
- 4 Mullen Way
- 60 Miranda Way
- 86 Wall St
- 180 Main St Unit A15
- 180 Main St Unit A5
- 603 East St
- 29 Ellis Ave
- 227 S Elm Lot2
- 10 Charles St
- 323 S Elm St
- 74 Mount Prospect St