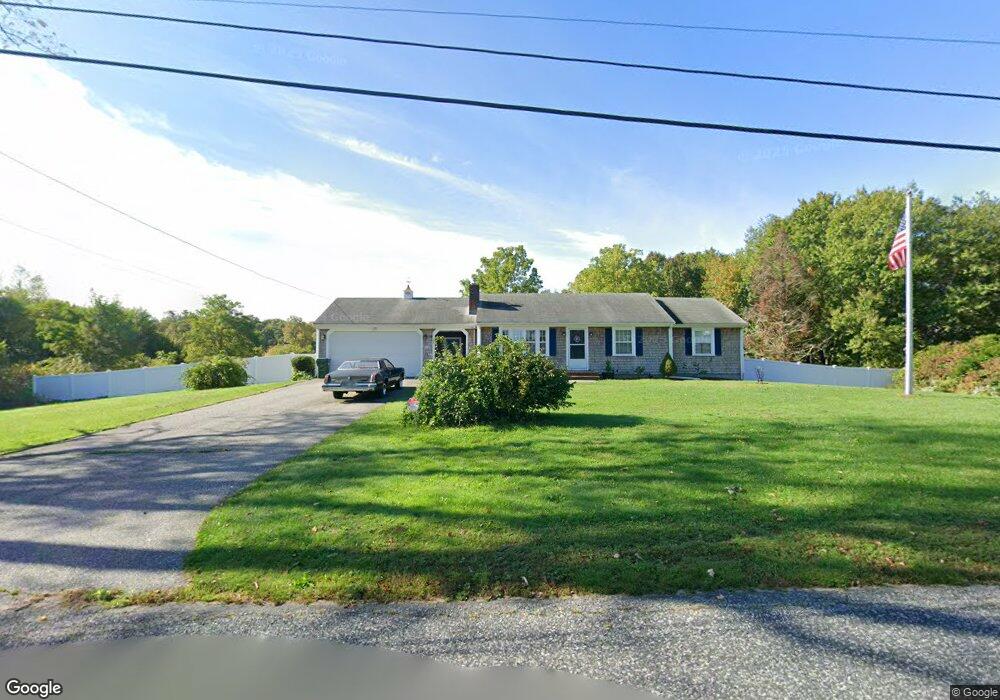
269 Summer St Rehoboth, MA 02769
Estimated Value: $520,317 - $601,000
3
Beds
1
Bath
1,200
Sq Ft
$457/Sq Ft
Est. Value
About This Home
This home is located at 269 Summer St, Rehoboth, MA 02769 and is currently estimated at $548,329, approximately $456 per square foot. 269 Summer St is a home located in Bristol County with nearby schools including Dighton-Rehoboth Regional High School and Cedar Brook School.
Ownership History
Date
Name
Owned For
Owner Type
Purchase Details
Closed on
Mar 9, 2016
Sold by
Arnold Carol B
Bought by
Moniz Steven
Current Estimated Value
Home Financials for this Owner
Home Financials are based on the most recent Mortgage that was taken out on this home.
Original Mortgage
$190,000
Outstanding Balance
$151,080
Interest Rate
3.79%
Mortgage Type
New Conventional
Estimated Equity
$397,249
Purchase Details
Closed on
Sep 12, 2006
Sold by
Demattos Arthur and Arnold Carol B
Bought by
Demattos Arthur and Arnold Carol B
Purchase Details
Closed on
Mar 28, 2006
Sold by
Arnold Gregory N and Arnold Renee M
Bought by
Demattos Arthur and Demattos Eleanor M
Purchase Details
Closed on
Oct 15, 1999
Sold by
Demattos Ft and Demattos Arthur
Bought by
Demattos Frank
Home Financials for this Owner
Home Financials are based on the most recent Mortgage that was taken out on this home.
Original Mortgage
$18,000
Interest Rate
7.8%
Mortgage Type
Purchase Money Mortgage
Create a Home Valuation Report for This Property
The Home Valuation Report is an in-depth analysis detailing your home's value as well as a comparison with similar homes in the area
Home Values in the Area
Average Home Value in this Area
Purchase History
| Date | Buyer | Sale Price | Title Company |
|---|---|---|---|
| Moniz Steven | $250,000 | -- | |
| Demattos Arthur | -- | -- | |
| Demattos Arthur | -- | -- | |
| Demattos Frank | $18,000 | -- |
Source: Public Records
Mortgage History
| Date | Status | Borrower | Loan Amount |
|---|---|---|---|
| Open | Moniz Steven | $190,000 | |
| Previous Owner | Demattos Frank | $18,000 |
Source: Public Records
Tax History
| Year | Tax Paid | Tax Assessment Tax Assessment Total Assessment is a certain percentage of the fair market value that is determined by local assessors to be the total taxable value of land and additions on the property. | Land | Improvement |
|---|---|---|---|---|
| 2025 | $45 | $399,200 | $201,600 | $197,600 |
| 2024 | $4,584 | $403,500 | $218,900 | $184,600 |
| 2023 | $4,486 | $387,400 | $214,500 | $172,900 |
| 2022 | $4,326 | $341,400 | $197,600 | $143,800 |
| 2021 | $4,108 | $310,300 | $181,000 | $129,300 |
| 2020 | $4,042 | $308,100 | $189,000 | $119,100 |
| 2018 | $3,031 | $300,100 | $180,500 | $119,600 |
| 2017 | $3,430 | $273,100 | $180,500 | $92,600 |
| 2016 | $3,407 | $280,400 | $188,100 | $92,300 |
| 2015 | $3,209 | $260,700 | $179,900 | $80,800 |
| 2014 | $3,140 | $252,400 | $171,600 | $80,800 |
Source: Public Records
Map
Nearby Homes
- 67 Wheeler St
- 149 Broad St
- 23 Colonial Way
- 0 Winter St
- 20 School St
- 111 Summer St
- 16 Salisbury St
- 420 Chestnut St
- 6 Running Stream Rd
- 15 Hickory Ridge Rd
- 42 Tee Jay Dr
- 205 Providence St Bldr Lot 3
- 203 Providence St Bldr Lot 5
- 0 Wheaton Ave
- 321 Winthrop St
- 31 Woodland Way
- 8 Linden Ln
- 8 Linden Ln
- 145 Winthrop St
- 139 Winthrop St
Your Personal Tour Guide
Ask me questions while you tour the home.