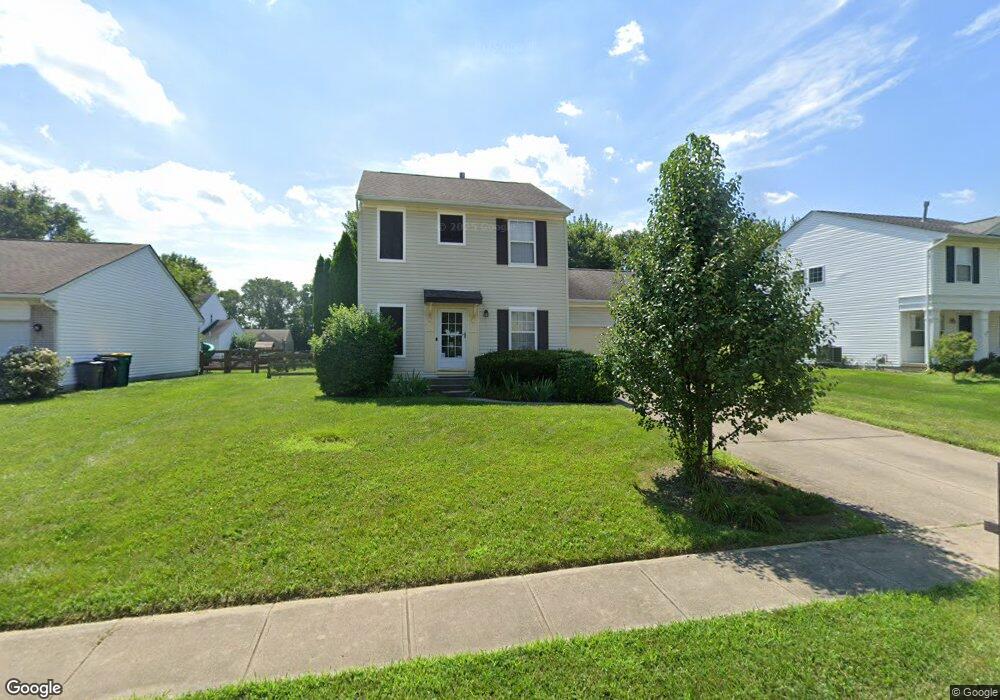
269 Village Dr Springboro, OH 45066
Estimated Value: $275,000 - $295,701
3
Beds
2
Baths
1,276
Sq Ft
$226/Sq Ft
Est. Value
About This Home
This home is located at 269 Village Dr, Springboro, OH 45066 and is currently estimated at $288,675, approximately $226 per square foot. 269 Village Dr is a home located in Warren County with nearby schools including Clearcreek Elementary School, Springboro Intermediate School, and Dennis Elementary School.
Ownership History
Date
Name
Owned For
Owner Type
Purchase Details
Closed on
Feb 10, 2021
Sold by
Hicks Erica L
Bought by
Vandewiele Nathan and Vandewiele Katie
Current Estimated Value
Home Financials for this Owner
Home Financials are based on the most recent Mortgage that was taken out on this home.
Original Mortgage
$187,900
Outstanding Balance
$168,056
Interest Rate
2.7%
Mortgage Type
New Conventional
Estimated Equity
$120,619
Purchase Details
Closed on
Mar 8, 2016
Sold by
Hicks Christopher P
Bought by
Hicks Erica L
Purchase Details
Closed on
Mar 6, 2000
Sold by
Brookfield Dev Corp
Bought by
Oberer Residential Const Ltd
Home Financials for this Owner
Home Financials are based on the most recent Mortgage that was taken out on this home.
Original Mortgage
$3,650,000
Interest Rate
8.27%
Mortgage Type
New Conventional
Create a Home Valuation Report for This Property
The Home Valuation Report is an in-depth analysis detailing your home's value as well as a comparison with similar homes in the area
Home Values in the Area
Average Home Value in this Area
Purchase History
| Date | Buyer | Sale Price | Title Company |
|---|---|---|---|
| Vandewiele Nathan | $199,900 | Landmark Ttl Agcy South Inc | |
| Hicks Erica L | -- | Attorney | |
| Oberer Residential Const Ltd | $86,700 | -- |
Source: Public Records
Mortgage History
| Date | Status | Borrower | Loan Amount |
|---|---|---|---|
| Open | Vandewiele Nathan | $187,900 | |
| Previous Owner | Oberer Residential Const Ltd | $3,650,000 |
Source: Public Records
Tax History Compared to Growth
Tax History
| Year | Tax Paid | Tax Assessment Tax Assessment Total Assessment is a certain percentage of the fair market value that is determined by local assessors to be the total taxable value of land and additions on the property. | Land | Improvement |
|---|---|---|---|---|
| 2024 | $3,596 | $87,560 | $31,500 | $56,060 |
| 2023 | $2,821 | $62,265 | $17,220 | $45,045 |
| 2022 | $2,759 | $62,265 | $17,220 | $45,045 |
| 2021 | $2,575 | $62,265 | $17,220 | $45,045 |
| 2020 | $2,398 | $50,621 | $14,000 | $36,621 |
| 2019 | $2,223 | $50,621 | $14,000 | $36,621 |
| 2018 | $2,086 | $50,621 | $14,000 | $36,621 |
| 2017 | $2,156 | $44,268 | $12,422 | $31,847 |
| 2016 | $2,237 | $44,268 | $12,422 | $31,847 |
| 2015 | $2,117 | $44,268 | $12,422 | $31,847 |
| 2014 | $2,031 | $40,240 | $11,290 | $28,950 |
| 2013 | $2,030 | $49,900 | $14,000 | $35,900 |
Source: Public Records
Map
Nearby Homes
- 175 S Lakeshore Dr
- 80 N Lakeshore Dr
- 6950 Red Lion 5 Points Rd
- 775 S Main St
- 1045 Ohio 73
- 44 Dunnington Ct
- 130 Magnolia Ln
- 165 Magnolia Ln
- Rockford Plan at Clearview Crossing
- Sanibel Plan at Clearview Crossing
- Birmingham Plan at Clearview Crossing
- Avalon Plan at Clearview Crossing
- Somerset Plan at Clearview Crossing
- The Longwood Plan at Clearview Crossing
- Dallas Plan at Clearview Crossing
- Carlisle Plan at Clearview Crossing
- 135 Magnolia Ln
- 85 Chestnut St
- 45 Chestnut St
- 55 Chestnut St
- 253 Village Dr
- 285 Village Dr
- 16 W Waterbury Dr
- 20 W Waterbury Dr
- 237 Village Dr
- 12 W Waterbury Dr
- 25 S Lakeshore Dr
- 280 Village Dr
- 260 Village Dr
- 24 W Waterbury Dr
- 240 Village Dr
- 221 Village Dr
- 75 S Lakeshore Dr
- 20 N Lakeshore Dr
- 10 E Long Meadow Dr
- 28 W Waterbury Dr
- 17 W Waterbury Dr
- 21 W Waterbury Dr
- 13 W Waterbury Dr
- 20 E Long Meadow Dr