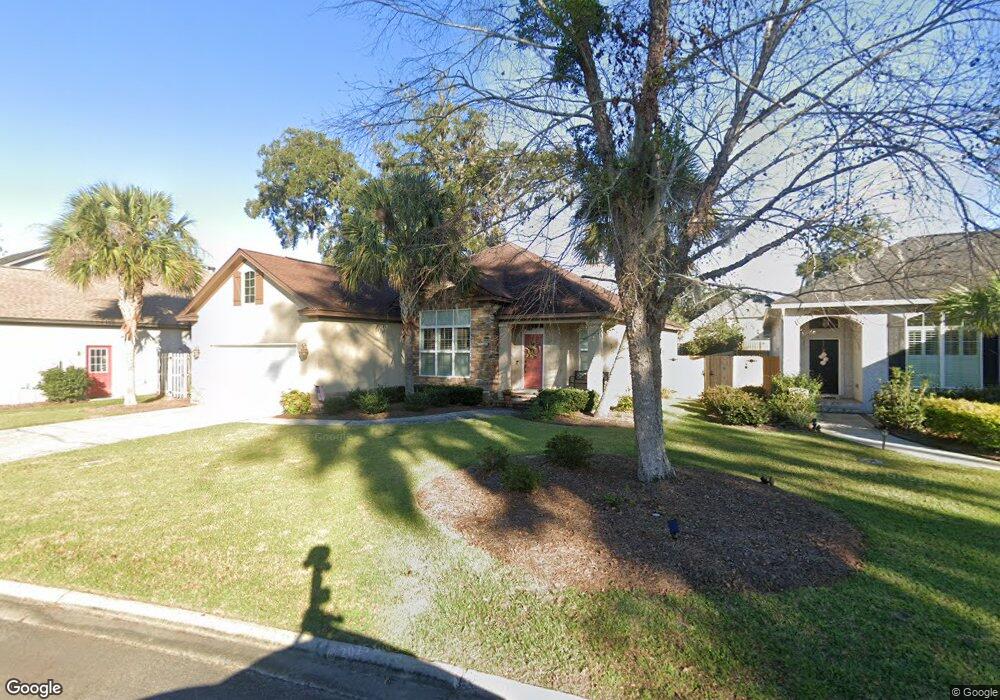
269 Villager Dr Unit 11 Saint Simons Island, GA 31522
Estimated Value: $581,066 - $697,000
3
Beds
3
Baths
1,785
Sq Ft
$346/Sq Ft
Est. Value
About This Home
This home is located at 269 Villager Dr Unit 11, Saint Simons Island, GA 31522 and is currently estimated at $618,017, approximately $346 per square foot. 269 Villager Dr Unit 11 is a home located in Glynn County with nearby schools including Oglethorpe Point Elementary School, Glynn Middle School, and Glynn Academy.
Ownership History
Date
Name
Owned For
Owner Type
Purchase Details
Closed on
Oct 2, 2019
Sold by
Golding Robert
Bought by
Wheeler Patricia A
Current Estimated Value
Home Financials for this Owner
Home Financials are based on the most recent Mortgage that was taken out on this home.
Original Mortgage
$329,650
Outstanding Balance
$287,550
Interest Rate
3.4%
Mortgage Type
New Conventional
Estimated Equity
$330,467
Purchase Details
Closed on
Nov 5, 2013
Sold by
Construction Bc Inc
Bought by
Golding Robert J and Golding Barbara P
Home Financials for this Owner
Home Financials are based on the most recent Mortgage that was taken out on this home.
Original Mortgage
$198,000
Interest Rate
4.26%
Mortgage Type
New Conventional
Purchase Details
Closed on
Jun 28, 2013
Sold by
Portman Investments Inc
Bought by
Construction Bc Inc
Create a Home Valuation Report for This Property
The Home Valuation Report is an in-depth analysis detailing your home's value as well as a comparison with similar homes in the area
Home Values in the Area
Average Home Value in this Area
Purchase History
| Date | Buyer | Sale Price | Title Company |
|---|---|---|---|
| Wheeler Patricia A | $347,000 | -- | |
| Golding Robert J | $298,000 | -- | |
| Construction Bc Inc | $123,000 | -- |
Source: Public Records
Mortgage History
| Date | Status | Borrower | Loan Amount |
|---|---|---|---|
| Open | Wheeler Patricia A | $329,650 | |
| Previous Owner | Golding Robert J | $198,000 |
Source: Public Records
Tax History Compared to Growth
Tax History
| Year | Tax Paid | Tax Assessment Tax Assessment Total Assessment is a certain percentage of the fair market value that is determined by local assessors to be the total taxable value of land and additions on the property. | Land | Improvement |
|---|---|---|---|---|
| 2025 | $4,804 | $191,560 | $30,000 | $161,560 |
| 2024 | $4,679 | $186,560 | $24,000 | $162,560 |
| 2023 | $2,821 | $186,560 | $24,000 | $162,560 |
| 2022 | $3,267 | $158,680 | $24,000 | $134,680 |
| 2021 | $3,365 | $142,400 | $24,000 | $118,400 |
| 2020 | $3,393 | $133,280 | $24,000 | $109,280 |
| 2019 | $3,574 | $132,080 | $24,000 | $108,080 |
| 2018 | $3,339 | $123,080 | $24,000 | $99,080 |
| 2017 | $3,104 | $114,080 | $24,000 | $90,080 |
| 2016 | $2,863 | $114,080 | $24,000 | $90,080 |
| 2015 | $2,874 | $114,080 | $24,000 | $90,080 |
| 2014 | $2,874 | $114,080 | $24,000 | $90,080 |
Source: Public Records
Map
Nearby Homes
- 257 Villager Dr
- 120 Southern Oaks Ln
- 1093 Captains Cove Way
- 193 Fifty Oaks Ln
- 195 Fifty Oaks Ln
- 19 Sinclair Way
- 300 S Harrington Rd
- 19 Wimbledon Ct
- 147 Fifty Oaks Ln
- 111 N Harrington Rd
- 123 Serenity Ln
- 874 Wimbledon Dr
- 1086 Sinclair Pointe
- 896 Wimbledon Dr
- 1194 Sea Palms Dr W
- 5725 Frederica & 1 43 Ac Frederica Rd
- 101 N Cottages Dr
- 662 N Golf Villas
- 668 N Golf Villa Rd
- 108 N Windward Dr
- 269 Villager Dr
- 267 Villager Dr
- 267 Villager Dr
- 271 Villager Dr Unit 12
- 271 Villager Dr
- 0 Villager Dr
- 265 Villager Dr
- 273 Villager Dr Unit 13
- 273 Villager Dr
- 270 Villager Dr Unit 20
- 270 Villager Dr
- 272 Villager Dr Unit 19
- 266 Villager Dr
- 275 Villager Dr Unit 14
- 275 Villager Dr
- 263 Villager Dr Unit 73
- 263 Villager Dr
- 157 Harrington Ln
- 151 Harrington Ln
- 260 Villager Dr