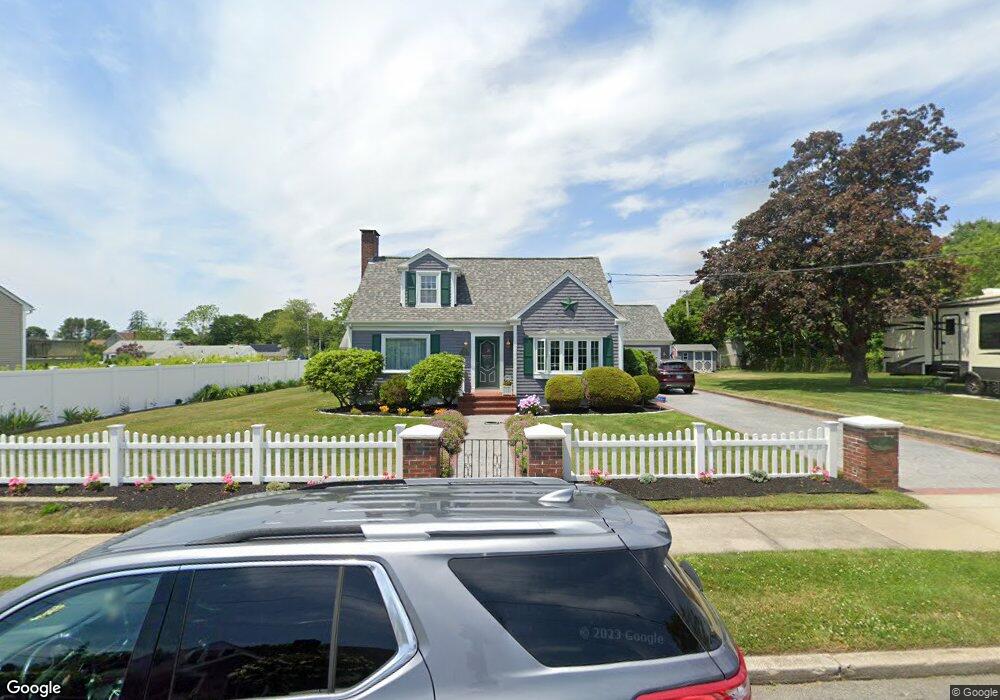
269 Wilbur St New Bedford, MA 02740
Rockdale NeighborhoodEstimated Value: $527,000 - $627,000
4
Beds
3
Baths
1,948
Sq Ft
$295/Sq Ft
Est. Value
About This Home
This home is located at 269 Wilbur St, New Bedford, MA 02740 and is currently estimated at $574,825, approximately $295 per square foot. 269 Wilbur St is a home located in Bristol County with nearby schools including Elizabeth Carter Brooks Elementary School, Keith Middle School, and New Bedford High School.
Ownership History
Date
Name
Owned For
Owner Type
Purchase Details
Closed on
Feb 16, 2023
Sold by
Pacheco Michael F and Pacheco Leona M
Bought by
Pacheco Ft
Current Estimated Value
Purchase Details
Closed on
May 10, 2000
Sold by
Champagne Kevin G and Champagne Michaela J
Bought by
Pacheco Michael F and Pacheco Leona M
Create a Home Valuation Report for This Property
The Home Valuation Report is an in-depth analysis detailing your home's value as well as a comparison with similar homes in the area
Home Values in the Area
Average Home Value in this Area
Purchase History
| Date | Buyer | Sale Price | Title Company |
|---|---|---|---|
| Pacheco Ft | -- | None Available | |
| Pacheco Ft | -- | None Available | |
| Pacheco Michael F | $180,000 | -- | |
| Pacheco Michael F | $180,000 | -- |
Source: Public Records
Mortgage History
| Date | Status | Borrower | Loan Amount |
|---|---|---|---|
| Previous Owner | Pacheco Michael F | $115,000 | |
| Previous Owner | Pacheco Michael F | $28,000 |
Source: Public Records
Tax History Compared to Growth
Tax History
| Year | Tax Paid | Tax Assessment Tax Assessment Total Assessment is a certain percentage of the fair market value that is determined by local assessors to be the total taxable value of land and additions on the property. | Land | Improvement |
|---|---|---|---|---|
| 2025 | $6,472 | $572,200 | $191,300 | $380,900 |
| 2024 | $6,032 | $502,700 | $183,800 | $318,900 |
| 2023 | $6,433 | $450,200 | $154,100 | $296,100 |
| 2022 | $6,000 | $386,100 | $146,500 | $239,600 |
| 2021 | $5,893 | $378,000 | $146,500 | $231,500 |
| 2020 | $5,743 | $355,400 | $146,500 | $208,900 |
| 2019 | $5,570 | $338,200 | $146,500 | $191,700 |
| 2018 | $5,471 | $329,000 | $158,200 | $170,800 |
| 2017 | $5,174 | $310,000 | $155,300 | $154,700 |
| 2016 | $4,931 | $299,000 | $152,400 | $146,600 |
| 2015 | $4,621 | $293,800 | $152,400 | $141,400 |
| 2014 | $4,415 | $291,200 | $152,400 | $138,800 |
Source: Public Records
Map
Nearby Homes
- 1249-1251 Rockdale Ave
- 129 Rowe St
- 818 Hathaway Rd
- 805 Hathaway Rd Unit 809
- 968 Geraldine St Unit 1A
- 48 Valley View Dr
- 5 Spring Hill Rd
- 0 Middlesex St
- ) Hapwell & Summit St
- 28 Harvard St
- 0 Norfolk Ave Unit 73403282
- 334 Austin St
- 194 Robeson St
- 81 Durfee St
- 317 Commonwealth Ave
- 70 Trinity St
- 71 Highland St
- 41 Tilton St
- 101 Willow St
- 70-72 Highland St