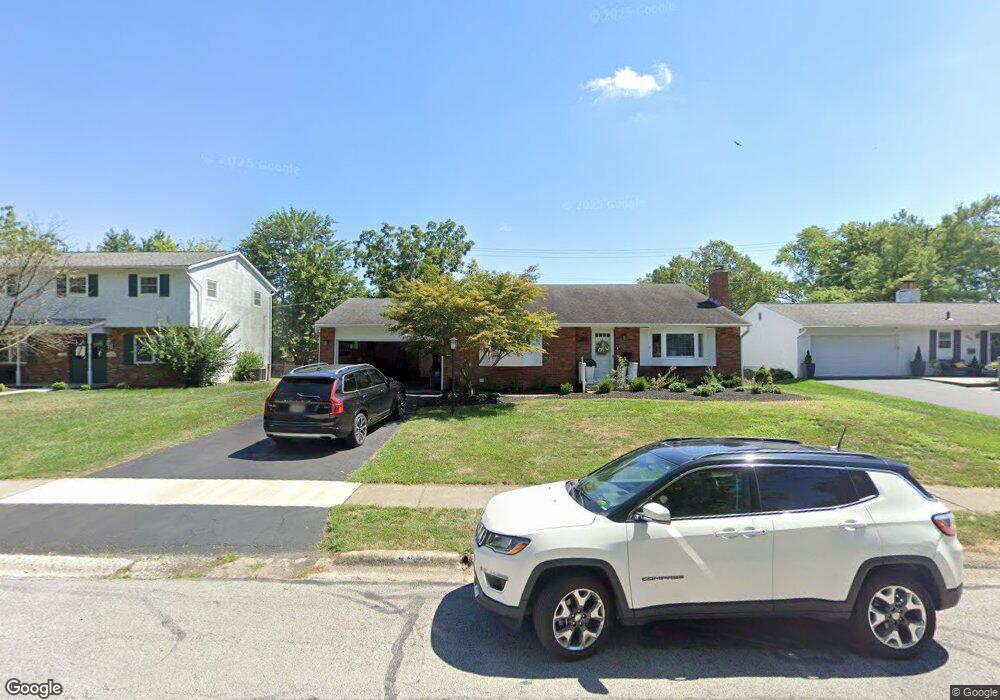
2690 Montcalm Rd Columbus, OH 43221
Estimated Value: $438,000 - $538,000
4
Beds
2
Baths
1,257
Sq Ft
$395/Sq Ft
Est. Value
About This Home
This home is located at 2690 Montcalm Rd, Columbus, OH 43221 and is currently estimated at $496,797, approximately $395 per square foot. 2690 Montcalm Rd is a home located in Franklin County with nearby schools including Tremont Elementary School, Jones Middle School, and Upper Arlington High School.
Ownership History
Date
Name
Owned For
Owner Type
Purchase Details
Closed on
Sep 27, 2021
Sold by
Dandrea Sandra A and The Sharick Family Trust
Bought by
Devore Weston and Ghidotti Denise
Current Estimated Value
Home Financials for this Owner
Home Financials are based on the most recent Mortgage that was taken out on this home.
Original Mortgage
$313,500
Outstanding Balance
$284,639
Interest Rate
2.8%
Mortgage Type
New Conventional
Estimated Equity
$212,158
Purchase Details
Closed on
Sep 4, 2015
Sold by
Sharick Nancy A and The Nancy A Sharick Revocable
Bought by
Sharick Nancy A
Purchase Details
Closed on
Jun 26, 2000
Sold by
Sharick Nancy A
Bought by
Livi Sharick Nancy A and Livi Nancy A Sharick Revocable
Purchase Details
Closed on
Apr 15, 1986
Bought by
Sharick Nancy A
Create a Home Valuation Report for This Property
The Home Valuation Report is an in-depth analysis detailing your home's value as well as a comparison with similar homes in the area
Home Values in the Area
Average Home Value in this Area
Purchase History
| Date | Buyer | Sale Price | Title Company |
|---|---|---|---|
| Devore Weston | $330,000 | Search 2 Close | |
| Sharick Nancy A | -- | None Available | |
| Andrea Sandra A D | -- | Attorney | |
| Sharick Nancy A | -- | Attorney | |
| Livi Sharick Nancy A | -- | -- | |
| Sharick Nancy A | -- | -- |
Source: Public Records
Mortgage History
| Date | Status | Borrower | Loan Amount |
|---|---|---|---|
| Open | Devore Weston | $313,500 |
Source: Public Records
Tax History Compared to Growth
Tax History
| Year | Tax Paid | Tax Assessment Tax Assessment Total Assessment is a certain percentage of the fair market value that is determined by local assessors to be the total taxable value of land and additions on the property. | Land | Improvement |
|---|---|---|---|---|
| 2024 | $8,847 | $152,810 | $70,560 | $82,250 |
| 2023 | $8,737 | $152,810 | $70,560 | $82,250 |
| 2022 | $7,873 | $112,670 | $53,200 | $59,470 |
| 2021 | $6,969 | $112,670 | $53,200 | $59,470 |
| 2020 | $6,908 | $112,670 | $53,200 | $59,470 |
| 2019 | $6,558 | $94,570 | $53,200 | $41,370 |
| 2018 | $5,482 | $94,570 | $53,200 | $41,370 |
| 2017 | $6,507 | $94,570 | $53,200 | $41,370 |
| 2016 | $4,999 | $75,600 | $28,350 | $47,250 |
| 2015 | $4,416 | $75,600 | $28,350 | $47,250 |
| 2014 | $4,421 | $75,600 | $28,350 | $47,250 |
| 2013 | $2,322 | $75,600 | $28,350 | $47,250 |
Source: Public Records
Map
Nearby Homes
- 2648 Chester Rd
- 2569 Chester Rd
- 1111 Sunny Hill Dr
- 1565 Berkshire Rd
- 2615 Northwest Blvd
- 1481 Doone Rd
- 1535 Doone Rd
- 1098 Stanhope Dr
- 3015 Welsford Rd
- 3156 Mt Holyoke Rd
- 965 Manor Ln Unit W
- 1980 W Lane Ave
- 1909 Inchcliff Rd
- 2110 Northwest Blvd
- 1887-1891 Kentwell Rd
- 3106 Somerford Rd
- 2027-2033 Ridgeview Rd
- 970 Oberlin Dr
- 2063 Westover Rd
- 1398 Lower Green Cir Unit 1398
- 2680 Montcalm Rd
- 2700 Montcalm Rd
- 2691 North Star Rd
- 2699 North Star Rd
- 2699 N Star Rd
- 2683 N Star Rd
- 2683 North Star Rd
- 2710 Montcalm Rd
- 2670 Montcalm Rd
- 2691 Montcalm Rd
- 2707 North Star Rd
- 2701 Montcalm Rd
- 2675 North Star Rd
- 2671 Montcalm Rd
- 2660 Montcalm Rd
- 2720 Montcalm Rd
- 2715 North Star Rd
- 2663 N Star Rd
- 2663 North Star Rd
- 2661 Montcalm Rd