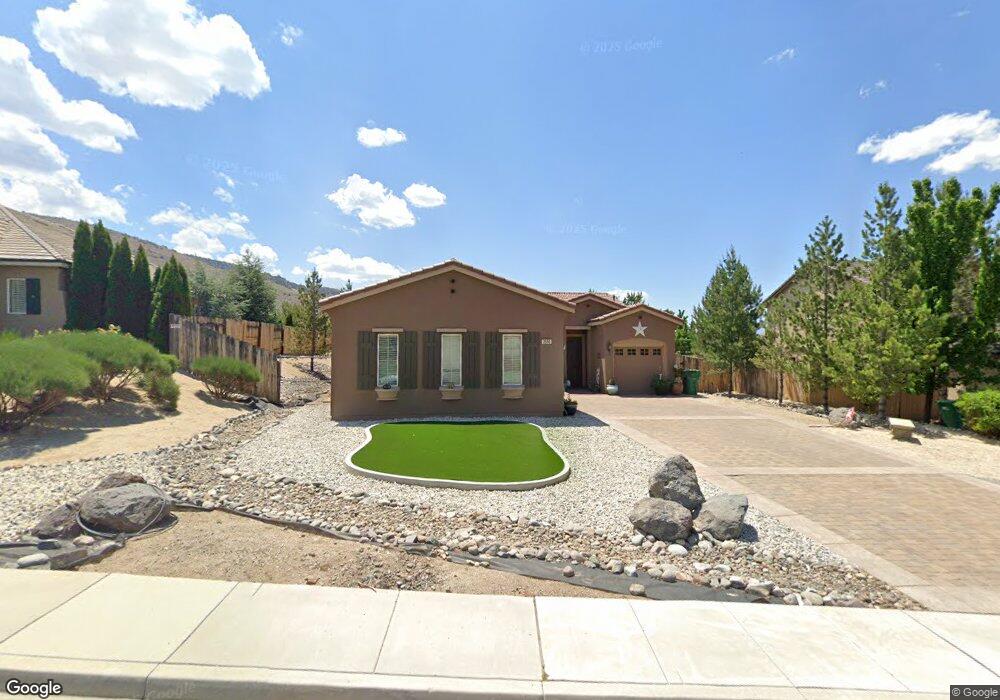
2690 Mule Cir Reno, NV 89521
Virginia Foothills NeighborhoodEstimated Value: $752,861 - $787,000
3
Beds
2
Baths
1,904
Sq Ft
$406/Sq Ft
Est. Value
About This Home
This home is located at 2690 Mule Cir, Reno, NV 89521 and is currently estimated at $773,215, approximately $406 per square foot. 2690 Mule Cir is a home located in Washoe County with nearby schools including Jwood Raw Elementary School, Kendyl Depoali Middle School, and Damonte Ranch High School.
Ownership History
Date
Name
Owned For
Owner Type
Purchase Details
Closed on
Dec 22, 2017
Sold by
Alstead Bryce C
Bought by
Bartlett John S and Alstead Bartlett Linda J
Current Estimated Value
Home Financials for this Owner
Home Financials are based on the most recent Mortgage that was taken out on this home.
Original Mortgage
$300,000
Outstanding Balance
$251,120
Interest Rate
3.9%
Mortgage Type
Commercial
Estimated Equity
$522,095
Purchase Details
Closed on
Feb 17, 2010
Sold by
P & C Investment Llc
Bought by
Alstead Bryce
Home Financials for this Owner
Home Financials are based on the most recent Mortgage that was taken out on this home.
Original Mortgage
$206,880
Interest Rate
5.03%
Mortgage Type
New Conventional
Purchase Details
Closed on
Jul 17, 2007
Sold by
Howard R Craig and Howard Patricia B
Bought by
P & C Investment Llc
Purchase Details
Closed on
May 3, 2007
Sold by
Reynen & Bardis Communities Nevada Inc
Bought by
Howard R Craig and Howard Patricia B
Create a Home Valuation Report for This Property
The Home Valuation Report is an in-depth analysis detailing your home's value as well as a comparison with similar homes in the area
Home Values in the Area
Average Home Value in this Area
Purchase History
| Date | Buyer | Sale Price | Title Company |
|---|---|---|---|
| Bartlett John S | $403,500 | First Centennial Reno | |
| Alstead Bryce | $259,000 | Ticor Title Reno | |
| P & C Investment Llc | -- | None Available | |
| Howard R Craig | $436,000 | First American Title |
Source: Public Records
Mortgage History
| Date | Status | Borrower | Loan Amount |
|---|---|---|---|
| Open | Bartlett John S | $300,000 | |
| Previous Owner | Alstead Bryce | $206,880 |
Source: Public Records
Tax History
| Year | Tax Paid | Tax Assessment Tax Assessment Total Assessment is a certain percentage of the fair market value that is determined by local assessors to be the total taxable value of land and additions on the property. | Land | Improvement |
|---|---|---|---|---|
| 2026 | -- | $167,311 | $58,275 | $109,036 |
| 2024 | $3,676 | $165,119 | $53,935 | $111,184 |
| 2023 | $3,676 | $159,468 | $54,810 | $104,658 |
| 2022 | $3,570 | $135,141 | $48,160 | $86,981 |
| 2021 | $3,466 | $126,476 | $40,145 | $86,331 |
| 2020 | $3,362 | $123,724 | $37,415 | $86,309 |
| 2019 | $3,264 | $120,098 | $36,925 | $83,173 |
| 2018 | $3,176 | $106,682 | $26,040 | $80,642 |
| 2017 | $3,085 | $106,738 | $26,040 | $80,698 |
| 2016 | $3,006 | $106,837 | $24,430 | $82,407 |
| 2015 | $3,004 | $103,749 | $21,945 | $81,804 |
| 2014 | $2,915 | $90,112 | $17,500 | $72,612 |
| 2013 | -- | $80,758 | $15,190 | $65,568 |
Source: Public Records
Map
Nearby Homes
- 10380 Cavalry Cir
- 2840 Trail Rider Dr
- 10110 Cavalry Cir
- 2610 Trail Rider Dr
- 10326 Palladium Mine Dr
- 2780 Tobiano Dr
- 2810 Tobiano Dr
- 2655 Friesian Ct
- 2650 Fury Ct
- 7891 Willow Thicket Dr
- 7872 Willow Thicket Dr Unit Homesite 677
- 7981 Desert Sapling Dr Unit Homesite 2658
- 10700 Summer Glen Dr
- 9890 Kerrydale Ct
- 10755 Copper Lake Dr
- 10663 Fort Morgan Way
- 2185 Eagle Greens Dr
- 2295 Trakehner Ln
- 2250 Trakehner Ln
- 2130 Evergreen Park Dr
- 2680 Mule Cir
- 2694 Mule Cir
- 2698 Mule Cir
- 2670 Mule Cir
- 2685 Mule Cir
- 2675 Mule Cir
- 2695 Mule Cir
- 2665 Mule Cir
- 2660 Mule Cir
- 2655 Mule Cir Unit Unfurnished Bedroom
- 2655 Mule Cir
- 10195 Gold Mine Dr
- 10398 Cavalry Cir
- 10205 Gold Mine Dr
- 2650 Mule Cir
- 00 McCauley Ranch Blvd
- 2645 Mule Cir
- 10185 Gold Mine Dr
- 10190 Gold Mine Dr
- 10215 Gold Mine Dr
Your Personal Tour Guide
Ask me questions while you tour the home.