Estimated Value: $569,000 - $608,000
3
Beds
1
Bath
1,486
Sq Ft
$393/Sq Ft
Est. Value
About This Home
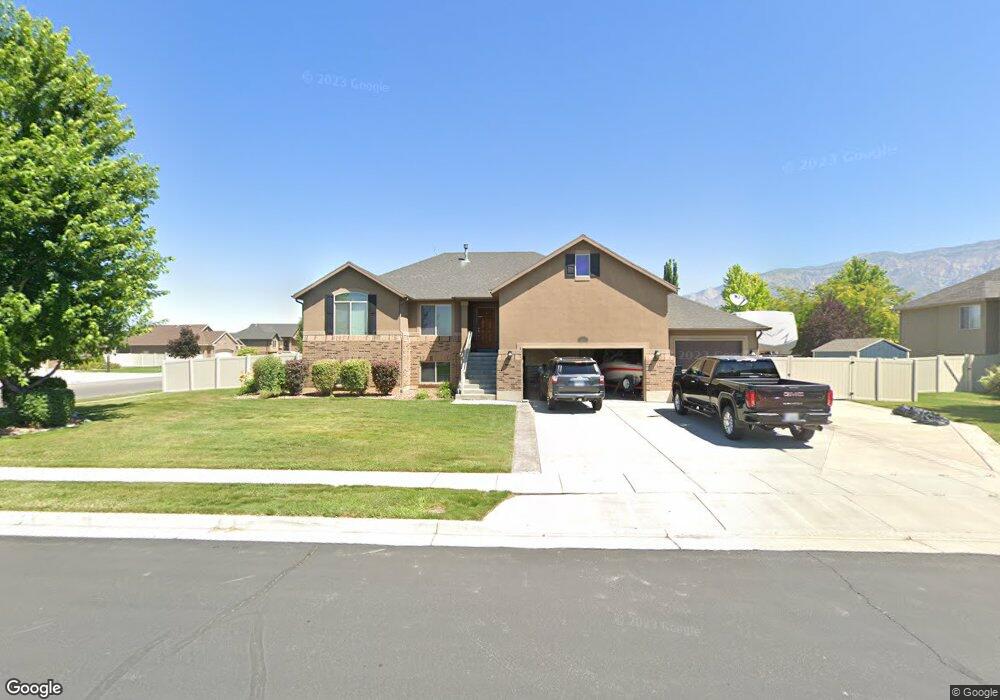
This home is located at 2690 W 2400 N, Ogden, UT 84404 and is currently estimated at $584,387, approximately $393 per square foot. 2690 W 2400 N is a home located in Weber County with nearby schools including Farr West Elementary School, Wahlquist Junior High School, and Fremont High School.
Ownership History
Date
Name
Owned For
Owner Type
Purchase Details
Closed on
Oct 2, 2008
Sold by
Destination Homes Inc
Bought by
Gibson Travis L and Gibson Suzanne M
Current Estimated Value
Home Financials for this Owner
Home Financials are based on the most recent Mortgage that was taken out on this home.
Original Mortgage
$249,726
Outstanding Balance
$164,020
Interest Rate
6.43%
Mortgage Type
FHA
Estimated Equity
$420,367
Purchase Details
Closed on
Nov 20, 2007
Sold by
Valeo Management Corp
Bought by
Destination Homes Inc
Create a Home Valuation Report for This Property
The Home Valuation Report is an in-depth analysis detailing your home's value as well as a comparison with similar homes in the area
Home Values in the Area
Average Home Value in this Area
Purchase History
| Date | Buyer | Sale Price | Title Company |
|---|---|---|---|
| Gibson Travis L | -- | Bonneville Superior Title Co | |
| Destination Homes Inc | -- | Mountain View Title Ogden |
Source: Public Records
Mortgage History
| Date | Status | Borrower | Loan Amount |
|---|---|---|---|
| Open | Gibson Travis L | $249,726 |
Source: Public Records
Tax History Compared to Growth
Tax History
| Year | Tax Paid | Tax Assessment Tax Assessment Total Assessment is a certain percentage of the fair market value that is determined by local assessors to be the total taxable value of land and additions on the property. | Land | Improvement |
|---|---|---|---|---|
| 2025 | $3,052 | $532,519 | $200,000 | $332,519 |
| 2024 | $3,024 | $295,349 | $110,000 | $185,349 |
| 2023 | $3,006 | $290,400 | $109,800 | $180,600 |
| 2022 | $3,258 | $321,750 | $99,003 | $222,747 |
| 2021 | $2,748 | $458,000 | $105,007 | $352,993 |
| 2020 | $2,586 | $395,000 | $85,008 | $309,992 |
| 2019 | $2,516 | $363,000 | $85,038 | $277,962 |
| 2018 | $2,468 | $341,000 | $85,038 | $255,962 |
| 2017 | $2,186 | $293,000 | $78,006 | $214,994 |
| 2016 | $1,941 | $140,536 | $36,001 | $104,535 |
| 2015 | $1,841 | $131,280 | $36,001 | $95,279 |
| 2014 | $1,668 | $115,965 | $33,114 | $82,851 |
Source: Public Records
Map
Nearby Homes
- 2705 2825 W Unit 67
- 2495 N 2850 W
- 2307 N 2850 W
- 2540 W 2575 N
- 2172 N 2625 W
- 2443 W 2950 N Unit 99
- 2443 W 2950 N
- 2673 W 2125 N
- 2176 N 2900 W
- 2124 Heritage Dr
- 3047 N 2875 W Unit 7
- 2068 N 2850 W
- 2730 N 2775 W Unit 113
- 2788 W 2775 N Unit 104
- 2950 W 1975 N
- 2405 W 2825 N
- 2801 W 1900 N
- 2442 W 2850 N
- 2477 W 2900 N
- 2440 W 2900 N
- 2676 W 2400 N
- 2436 N 2700 W Unit 118
- 2436 N 2700 W
- 2673 W 2450 N
- 2407 N 2700 W
- 2388 N 2700 W
- 2423 N 2700 W
- 2662 W 2400 N
- 2679 W 2400 N
- 2393 N 2700 W
- 2441 N 2700 W
- 2661 W 2450 N
- 2665 W 2400 N
- 2377 N 2700 W
- 4613 W 2400 N Unit 10
- 4589 W 2400 N Unit 9
- 2362 N 2700 W
- 2457 N 2700 W
- 2644 W 2400 N
- 2688 W 2450 N