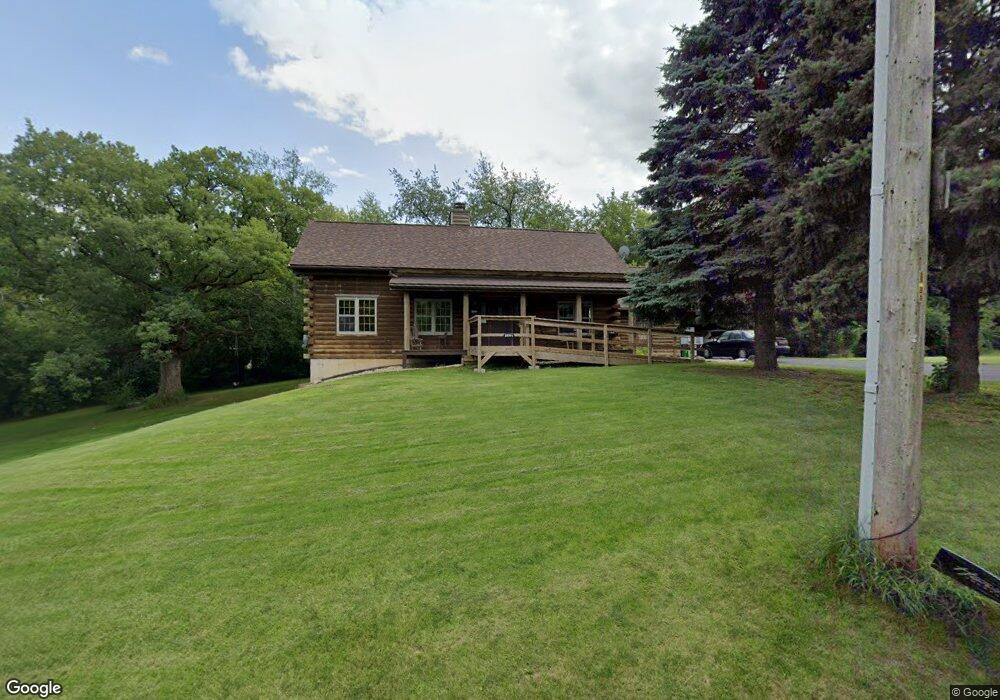
26901 W Burkhart Ln Ingleside, IL 60041
Wooster Lake NeighborhoodEstimated Value: $412,000 - $422,000
2
Beds
3
Baths
3,000
Sq Ft
$139/Sq Ft
Est. Value
About This Home
This home is located at 26901 W Burkhart Ln, Ingleside, IL 60041 and is currently estimated at $416,479, approximately $138 per square foot. 26901 W Burkhart Ln is a home located in Lake County with nearby schools including Big Hollow Primary School, Big Hollow Elementary School, and Big Hollow Middle School.
Ownership History
Date
Name
Owned For
Owner Type
Purchase Details
Closed on
Mar 21, 2014
Sold by
Mecher John P and Mecher Cheryl A
Bought by
Mecher John P and Mecher Cheryl A
Current Estimated Value
Purchase Details
Closed on
Jan 23, 2000
Sold by
Teeter Randy E and Teeter Kathy J
Bought by
Mecher John P and Mecher Cheryl A
Home Financials for this Owner
Home Financials are based on the most recent Mortgage that was taken out on this home.
Original Mortgage
$118,500
Interest Rate
7.84%
Purchase Details
Closed on
Aug 20, 1997
Sold by
Lang Fred A and Lang Ruby J
Bought by
Teeter Randy E and Teeter Kathy J
Home Financials for this Owner
Home Financials are based on the most recent Mortgage that was taken out on this home.
Original Mortgage
$194,750
Interest Rate
7.24%
Purchase Details
Closed on
Jan 31, 1996
Sold by
Lang Frederick A
Bought by
Lang Fred A and Lang Ruby J
Home Financials for this Owner
Home Financials are based on the most recent Mortgage that was taken out on this home.
Original Mortgage
$185,550
Interest Rate
7.24%
Create a Home Valuation Report for This Property
The Home Valuation Report is an in-depth analysis detailing your home's value as well as a comparison with similar homes in the area
Home Values in the Area
Average Home Value in this Area
Purchase History
| Date | Buyer | Sale Price | Title Company |
|---|---|---|---|
| Mecher John P | -- | None Available | |
| Mecher John P | $214,000 | -- | |
| Teeter Randy E | $205,000 | Blackhawk Title Services | |
| Lang Fred A | -- | First American Title |
Source: Public Records
Mortgage History
| Date | Status | Borrower | Loan Amount |
|---|---|---|---|
| Closed | Mecher John P | $118,500 | |
| Previous Owner | Teeter Randy E | $194,750 | |
| Previous Owner | Lang Fred A | $185,550 |
Source: Public Records
Tax History Compared to Growth
Tax History
| Year | Tax Paid | Tax Assessment Tax Assessment Total Assessment is a certain percentage of the fair market value that is determined by local assessors to be the total taxable value of land and additions on the property. | Land | Improvement |
|---|---|---|---|---|
| 2024 | $3,062 | $86,305 | $20,691 | $65,614 |
| 2023 | $3,062 | $81,305 | $19,492 | $61,813 |
| 2022 | $3,872 | $73,236 | $12,686 | $60,550 |
| 2021 | $4,063 | $69,032 | $11,958 | $57,074 |
| 2020 | $4,196 | $75,542 | $11,788 | $63,754 |
| 2019 | $5,876 | $74,406 | $11,303 | $63,103 |
| 2018 | $4,365 | $78,599 | $10,923 | $67,676 |
| 2017 | $4,442 | $72,649 | $10,096 | $62,553 |
| 2016 | $4,949 | $66,444 | $9,234 | $57,210 |
| 2015 | $5,144 | $62,004 | $8,617 | $53,387 |
| 2014 | $5,007 | $56,747 | $8,599 | $48,148 |
| 2012 | $6,083 | $58,392 | $8,960 | $49,432 |
Source: Public Records
Map
Nearby Homes
- 27254 W Nippersink Rd
- 34052 N Fischer Dr
- 545 Blue Springs Dr
- 642 Key Largo Dr Unit 82
- 340 Terra Springs Cir
- 2032 Wentworth Dr
- 1855 Alta Dr
- 603 Illinois Route 59
- 1370 U S 12
- 33703 N Christa Dr
- 26183 W Wooster Lake Ave
- 26931 W Marion Ct
- 35107 N Rosewood Ave
- 35025 N Ingleside Dr
- 250 Annelise Ln
- 34550 N Wilson Rd
- 160 N Us Highway 12
- 26297 W Larkin Ln
- 1519 Prescott Dr
- 26276 W Larkin Ln
- 26863 W Burkhart Ln
- 26920 W Burkhart Ln
- 26878 W Burkhart Ln
- 26969 W Nippersink Rd
- 26860 W Burkhart Ln
- 26930 W Nippersink Rd
- 26964 W Burkhart Ln
- 26949 W Nippersink Rd
- 26940 W Nippersink Rd
- 27063 W Wooster Ln
- 26975 W Nippersink Rd
- 26915 W Nippersink Rd
- 27025 W Wooster Ln
- 26888 W Nippersink Rd
- 111 Harvest Ct
- 109 Harvest Ct
- 112 Harvest Ct
- 110 Harvest Ct
- 113 Oak Knoll Ct
- 114 Oak Knoll Ct