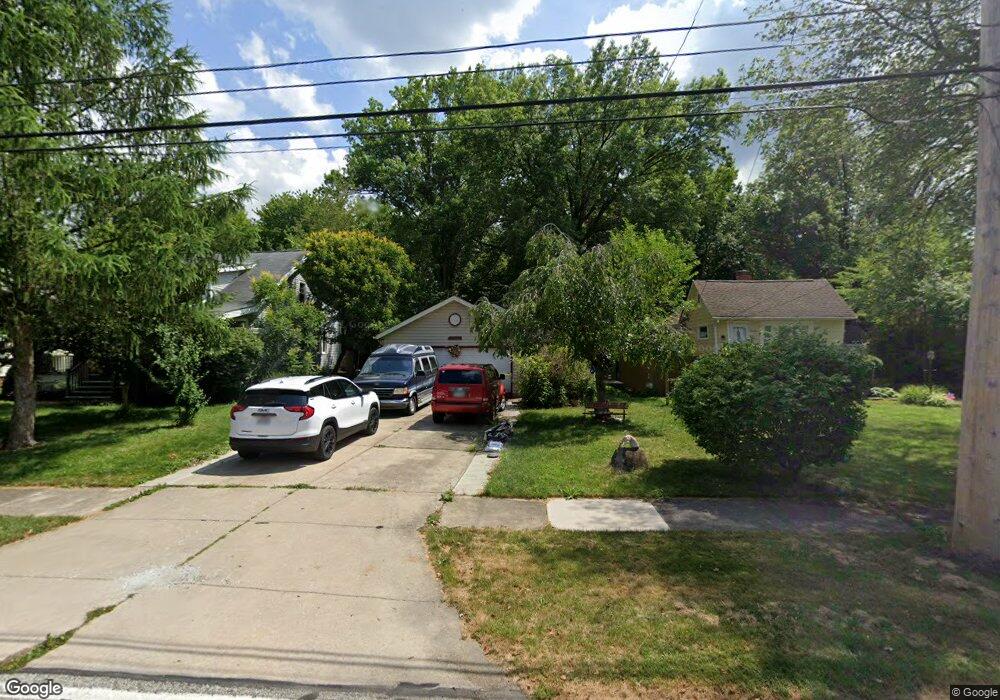
26905 1st St Westlake, OH 44145
Estimated Value: $271,068 - $302,000
2
Beds
2
Baths
1,160
Sq Ft
$247/Sq Ft
Est. Value
About This Home
This home is located at 26905 1st St, Westlake, OH 44145 and is currently estimated at $286,267, approximately $246 per square foot. 26905 1st St is a home located in Cuyahoga County with nearby schools including Westlake Elementary School, Dover Intermediate School, and Lee Burneson Middle School.
Ownership History
Date
Name
Owned For
Owner Type
Purchase Details
Closed on
Sep 29, 1995
Sold by
Lusardo David A
Bought by
Bowen James D and Bowen Susan C
Current Estimated Value
Home Financials for this Owner
Home Financials are based on the most recent Mortgage that was taken out on this home.
Original Mortgage
$9,890
Outstanding Balance
$72
Interest Rate
8%
Mortgage Type
New Conventional
Estimated Equity
$286,195
Purchase Details
Closed on
Dec 21, 1994
Sold by
Ross Thomas W
Bought by
Lusardo David A and Lusardo Patricia M
Purchase Details
Closed on
Mar 3, 1994
Sold by
Ross Thomas W
Bought by
Ross Thomas W
Purchase Details
Closed on
Aug 16, 1979
Sold by
Frank Clarice R
Bought by
Ross Thomas W
Purchase Details
Closed on
May 1, 1978
Sold by
Frank Clarice R and Frank Gilbert R
Bought by
Frank Clarice R
Purchase Details
Closed on
Jan 1, 1975
Bought by
Frank Clarice R and Frank Gilbert R
Create a Home Valuation Report for This Property
The Home Valuation Report is an in-depth analysis detailing your home's value as well as a comparison with similar homes in the area
Home Values in the Area
Average Home Value in this Area
Purchase History
| Date | Buyer | Sale Price | Title Company |
|---|---|---|---|
| Bowen James D | $22,000 | -- | |
| Lusardo David A | $15,000 | -- | |
| Ross Thomas W | -- | -- | |
| Ross Thomas W | $11,200 | -- | |
| Frank Clarice R | -- | -- | |
| Frank Clarice R | -- | -- |
Source: Public Records
Mortgage History
| Date | Status | Borrower | Loan Amount |
|---|---|---|---|
| Open | Bowen James D | $9,890 |
Source: Public Records
Tax History Compared to Growth
Tax History
| Year | Tax Paid | Tax Assessment Tax Assessment Total Assessment is a certain percentage of the fair market value that is determined by local assessors to be the total taxable value of land and additions on the property. | Land | Improvement |
|---|---|---|---|---|
| 2024 | $3,665 | $87,150 | $14,665 | $72,485 |
| 2023 | $3,355 | $68,880 | $14,350 | $54,530 |
| 2022 | $3,279 | $68,880 | $14,350 | $54,530 |
| 2021 | $3,283 | $68,880 | $14,350 | $54,530 |
| 2020 | $3,139 | $61,500 | $12,810 | $48,690 |
| 2019 | $3,044 | $175,700 | $36,600 | $139,100 |
| 2018 | $3,058 | $61,500 | $12,810 | $48,690 |
| 2017 | $2,597 | $50,890 | $10,990 | $39,900 |
| 2016 | $2,583 | $50,890 | $10,990 | $39,900 |
| 2015 | $2,569 | $50,890 | $10,990 | $39,900 |
| 2014 | $2,424 | $47,570 | $10,260 | $37,310 |
Source: Public Records
Map
Nearby Homes
- 26927 E Oviatt Rd
- 27320 Langale Rd
- 27029 Normandy Rd
- 27028 Normandy Rd
- 468 Canterbury Rd
- 495 Cahoon Rd
- 1326 Marview Dr
- 481 Cahoon Rd
- 479 Cahoon Rd
- 27407 Wolf Rd
- 477 Cahoon Rd
- 27841 Birchwood Ct
- 28205 W Oviatt Rd
- 27870 Birchwood Ct
- 841 S Parkside Dr
- 1455 Mozart Dr
- 879 S Parkside Dr
- 1528 Dover Center Rd
- 1432 Stone Ct
- 349 Kenilworth Rd
- 26893 1st St
- 26923 1st St
- 26943 1st St
- 26875 1st St
- 26971 1st St
- 26859 1st St
- 843 Carriage Park Oval
- 26973 1st St
- 839 Carriage Park Oval
- 847 Carriage Park Oval
- 26906 1st St
- 26892 1st St
- 26944 1st St
- 26876 1st St
- 26960 1st St
- 26860 1st St
- 852 Carriage Park Oval
- 27007 1st St
- 835 Carriage Park Oval
- 26986 1st St