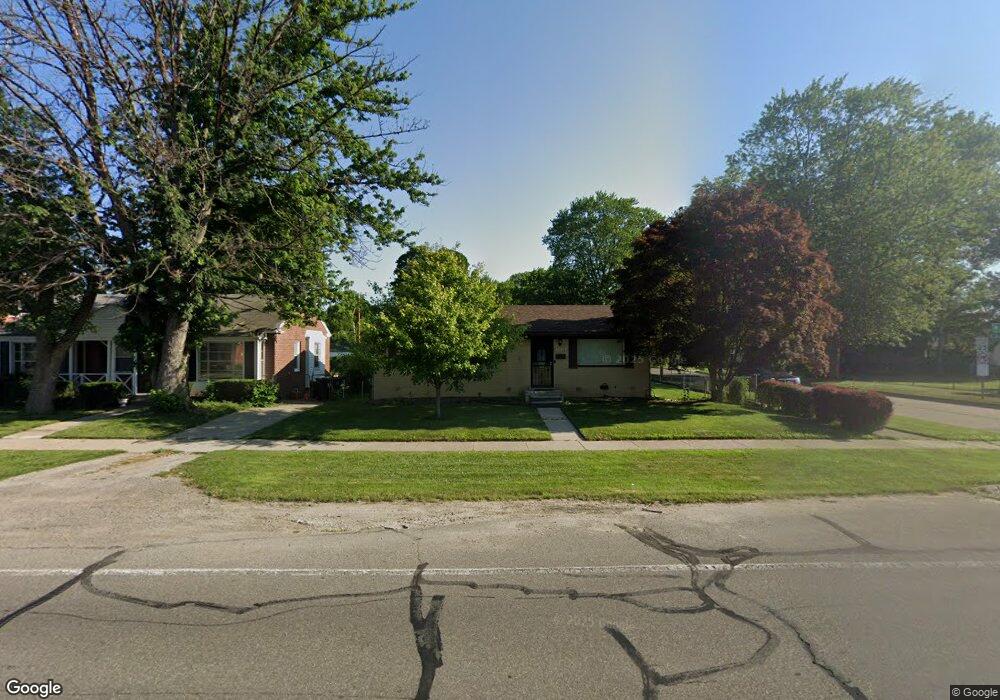
26906 W Chicago Redford, MI 48239
Estimated Value: $182,000 - $237,000
3
Beds
1
Bath
987
Sq Ft
$210/Sq Ft
Est. Value
About This Home
This home is located at 26906 W Chicago, Redford, MI 48239 and is currently estimated at $207,686, approximately $210 per square foot. 26906 W Chicago is a home located in Wayne County with nearby schools including John D. Pierce Middle School, Lee M. Thurston High School, and Westfield Charter Academy.
Ownership History
Date
Name
Owned For
Owner Type
Purchase Details
Closed on
Sep 8, 2011
Sold by
Hsbc Bank Usa N A
Bought by
Northley Thomas Scott
Current Estimated Value
Purchase Details
Closed on
Oct 7, 2010
Sold by
Collins Catresa
Bought by
Hsbc Bank Usa Na
Purchase Details
Closed on
Mar 7, 2007
Sold by
Ramsey Herbert
Bought by
Collins Catresa
Purchase Details
Closed on
Apr 14, 2005
Sold by
Regions Mortgage Inc
Bought by
Ramsey Herbert
Purchase Details
Closed on
Apr 14, 2004
Sold by
Pulter Brian
Bought by
Regions Mortgage Inc
Purchase Details
Closed on
Jul 27, 2000
Sold by
Botruff Carol
Bought by
Bankhead Michael L
Create a Home Valuation Report for This Property
The Home Valuation Report is an in-depth analysis detailing your home's value as well as a comparison with similar homes in the area
Home Values in the Area
Average Home Value in this Area
Purchase History
| Date | Buyer | Sale Price | Title Company |
|---|---|---|---|
| Northley Thomas Scott | $26,199 | First Centennial Title Inc | |
| Hsbc Bank Usa Na | $154,753 | None Available | |
| Collins Catresa | $145,000 | None Available | |
| Ramsey Herbert | $115,000 | Colonial Title Company | |
| Regions Mortgage Inc | $122,400 | -- | |
| Bankhead Michael L | $132,000 | -- |
Source: Public Records
Tax History Compared to Growth
Tax History
| Year | Tax Paid | Tax Assessment Tax Assessment Total Assessment is a certain percentage of the fair market value that is determined by local assessors to be the total taxable value of land and additions on the property. | Land | Improvement |
|---|---|---|---|---|
| 2025 | $1,060 | $84,500 | $0 | $0 |
| 2024 | $1,060 | $77,600 | $0 | $0 |
| 2023 | $1,014 | $67,700 | $0 | $0 |
| 2022 | $2,682 | $59,300 | $0 | $0 |
| 2021 | $2,603 | $57,000 | $0 | $0 |
| 2020 | $2,568 | $51,200 | $0 | $0 |
| 2019 | $2,515 | $42,000 | $0 | $0 |
| 2018 | $904 | $35,500 | $0 | $0 |
| 2017 | $2,744 | $34,700 | $0 | $0 |
| 2016 | $2,245 | $32,700 | $0 | $0 |
| 2015 | $2,723 | $29,000 | $0 | $0 |
| 2013 | $2,700 | $27,500 | $0 | $0 |
| 2012 | $1,895 | $30,400 | $7,700 | $22,700 |
Source: Public Records
Map
Nearby Homes