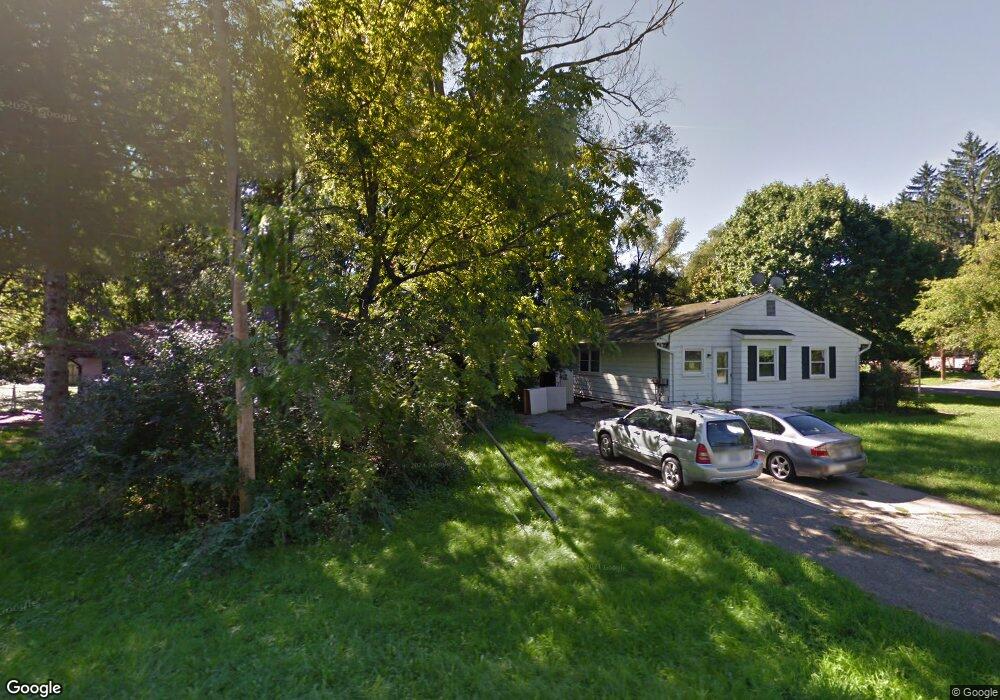
2691 Mansfield Dr East Lansing, MI 48823
Estimated Value: $277,987 - $301,000
4
Beds
2
Baths
1,632
Sq Ft
$176/Sq Ft
Est. Value
About This Home
This home is located at 2691 Mansfield Dr, East Lansing, MI 48823 and is currently estimated at $286,747, approximately $175 per square foot. 2691 Mansfield Dr is a home located in Ingham County with nearby schools including Bennett Woods Elementary School, Kinawa School, and Chippewa Middle School.
Ownership History
Date
Name
Owned For
Owner Type
Purchase Details
Closed on
Jun 1, 2017
Sold by
Crwford Jason J
Bought by
Stoner Kevin and Stoner Rebecca
Current Estimated Value
Home Financials for this Owner
Home Financials are based on the most recent Mortgage that was taken out on this home.
Original Mortgage
$159,354
Outstanding Balance
$132,367
Interest Rate
3.97%
Mortgage Type
VA
Estimated Equity
$154,380
Purchase Details
Closed on
Feb 21, 2003
Sold by
Wang Yi Liang and Wang Kam Sau
Bought by
Crawford Jason J
Home Financials for this Owner
Home Financials are based on the most recent Mortgage that was taken out on this home.
Original Mortgage
$133,841
Interest Rate
5.95%
Mortgage Type
FHA
Purchase Details
Closed on
Jan 20, 1997
Sold by
Rogers Warren A
Bought by
Wang Yi Liang and Kam Sau
Purchase Details
Closed on
Aug 1, 1991
Bought by
Rogers
Purchase Details
Closed on
May 1, 1987
Purchase Details
Closed on
Jun 1, 1985
Create a Home Valuation Report for This Property
The Home Valuation Report is an in-depth analysis detailing your home's value as well as a comparison with similar homes in the area
Home Values in the Area
Average Home Value in this Area
Purchase History
| Date | Buyer | Sale Price | Title Company |
|---|---|---|---|
| Stoner Kevin | $156,000 | None Available | |
| Crawford Jason J | $134,900 | Transnation Title | |
| Wang Yi Liang | $91,300 | -- | |
| Rogers | $88,800 | -- | |
| -- | $63,000 | -- | |
| -- | $54,900 | -- |
Source: Public Records
Mortgage History
| Date | Status | Borrower | Loan Amount |
|---|---|---|---|
| Open | Stoner Kevin | $159,354 | |
| Previous Owner | Crawford Jason J | $133,841 |
Source: Public Records
Tax History Compared to Growth
Tax History
| Year | Tax Paid | Tax Assessment Tax Assessment Total Assessment is a certain percentage of the fair market value that is determined by local assessors to be the total taxable value of land and additions on the property. | Land | Improvement |
|---|---|---|---|---|
| 2025 | $4,511 | $111,000 | $31,100 | $79,900 |
| 2024 | $4,186 | $104,200 | $29,700 | $74,500 |
| 2023 | $4,186 | $96,200 | $28,200 | $68,000 |
| 2022 | $4,025 | $84,000 | $24,200 | $59,800 |
| 2021 | $3,947 | $79,100 | $21,800 | $57,300 |
| 2020 | $3,855 | $75,700 | $21,800 | $53,900 |
| 2019 | $3,770 | $73,100 | $23,600 | $49,500 |
| 2018 | $3,584 | $70,300 | $24,200 | $46,100 |
| 2017 | $3,272 | $68,500 | $24,500 | $44,000 |
| 2016 | $1,732 | $65,300 | $23,000 | $42,300 |
| 2015 | $1,732 | $61,200 | $42,498 | $18,702 |
| 2014 | $1,732 | $55,500 | $36,676 | $18,824 |
Source: Public Records
Map
Nearby Homes
- 5120 Wardcliff Dr
- 2617 Greencliff Dr
- 5189 E Brookfield Dr
- 1626 River Terrace
- 1653 Ann St
- 2545 Koala Dr
- 1542 Ann St
- 5167 Sapphire Cir Unit 25
- 5420 Park Lake Rd
- 5435 Blue Haven Dr
- 5162 Sapphire Cir Unit 31
- 5283 E Hidden Lake Dr Unit 47
- 4793 Ottawa Dr
- 2343 Sapphire Ln Unit 48
- 692 Moorland Dr Unit 10
- 5359 Wild Oak Dr Unit 54
- 5403 Wild Oak Dr
- 586 Lexington Ave
- 562 Virginia Ave
- 2216 Iroquois Rd
- 5050 Wardcliff Dr
- 2683 Mansfield Dr
- 5052 Wardcliff Dr
- 2691 Rockwood Dr
- 2684 Mansfield Dr
- 2671 Mansfield Dr
- 2703 Rockwood Dr
- 2672 Mansfield Dr
- 5047 Wardcliff Dr
- 2671 Rockwood Dr
- 5057 Wardcliff Dr
- 2722 E Grand River Ave
- 2663 Mansfield Dr
- 2864 Rockwood Dr
- 2663 Rockwood Dr
- 5075 Wardcliff Dr
- 2700 E Grand River Ave
- 2692 Rockwood Dr
- 2704 Rockwood Dr